Fig. 6
Download original image
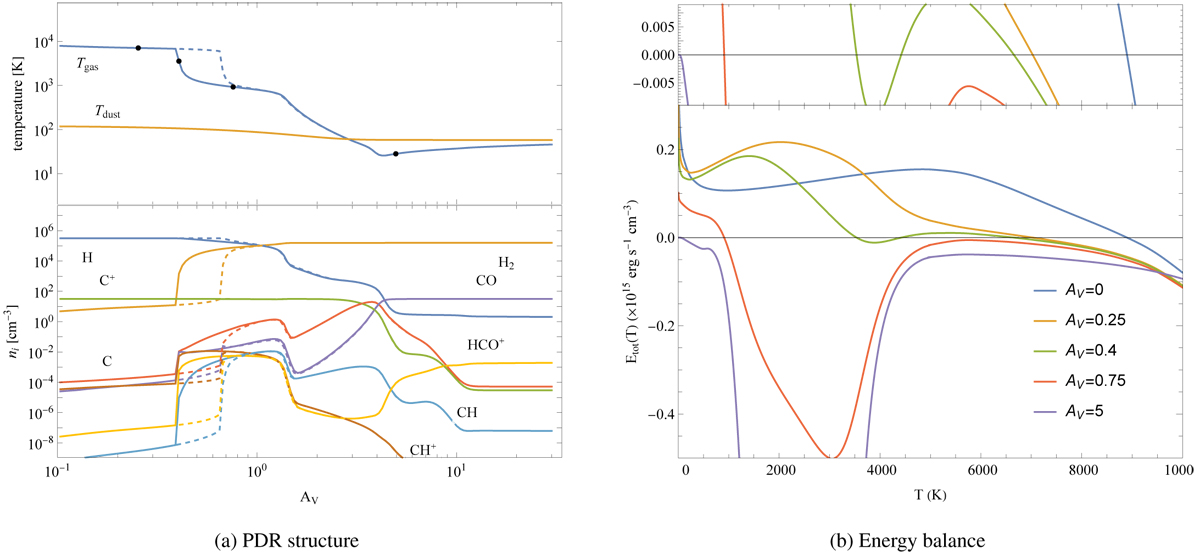
Two-temperature solution for the V4 benchmark model (n = 1055 cm−3, χ = 105). Left: Tg/d (top) and ni (bottom) profile. Solid and dashed lines correspond to the low and high temperature solutions (WMM and HAM. i.e., T1 and T3 from Fig. 5). Right: Etot(T) at selected positions in the PDR (marked by black points in Fig. 6a). The top panel magnifies the range around Etot = 0.
Current usage metrics show cumulative count of Article Views (full-text article views including HTML views, PDF and ePub downloads, according to the available data) and Abstracts Views on Vision4Press platform.
Data correspond to usage on the plateform after 2015. The current usage metrics is available 48-96 hours after online publication and is updated daily on week days.
Initial download of the metrics may take a while.