Open Access
Fig. A.1
Download original image
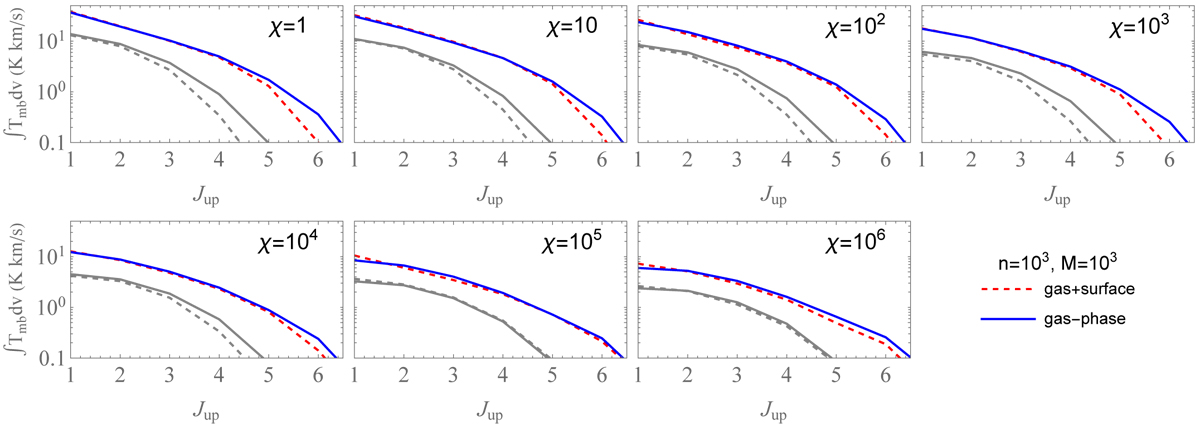
Effect of surface chemistry on the CO spectral line emission distribution (in K km s−1) as function of Jup for n0 = 103 cm−3. Each panel corresponds to a different FUV field strength χ. 12CO lines are in color, while 13CO lines are plotted in gray-level.
Current usage metrics show cumulative count of Article Views (full-text article views including HTML views, PDF and ePub downloads, according to the available data) and Abstracts Views on Vision4Press platform.
Data correspond to usage on the plateform after 2015. The current usage metrics is available 48-96 hours after online publication and is updated daily on week days.
Initial download of the metrics may take a while.