Fig. 17
Download original image
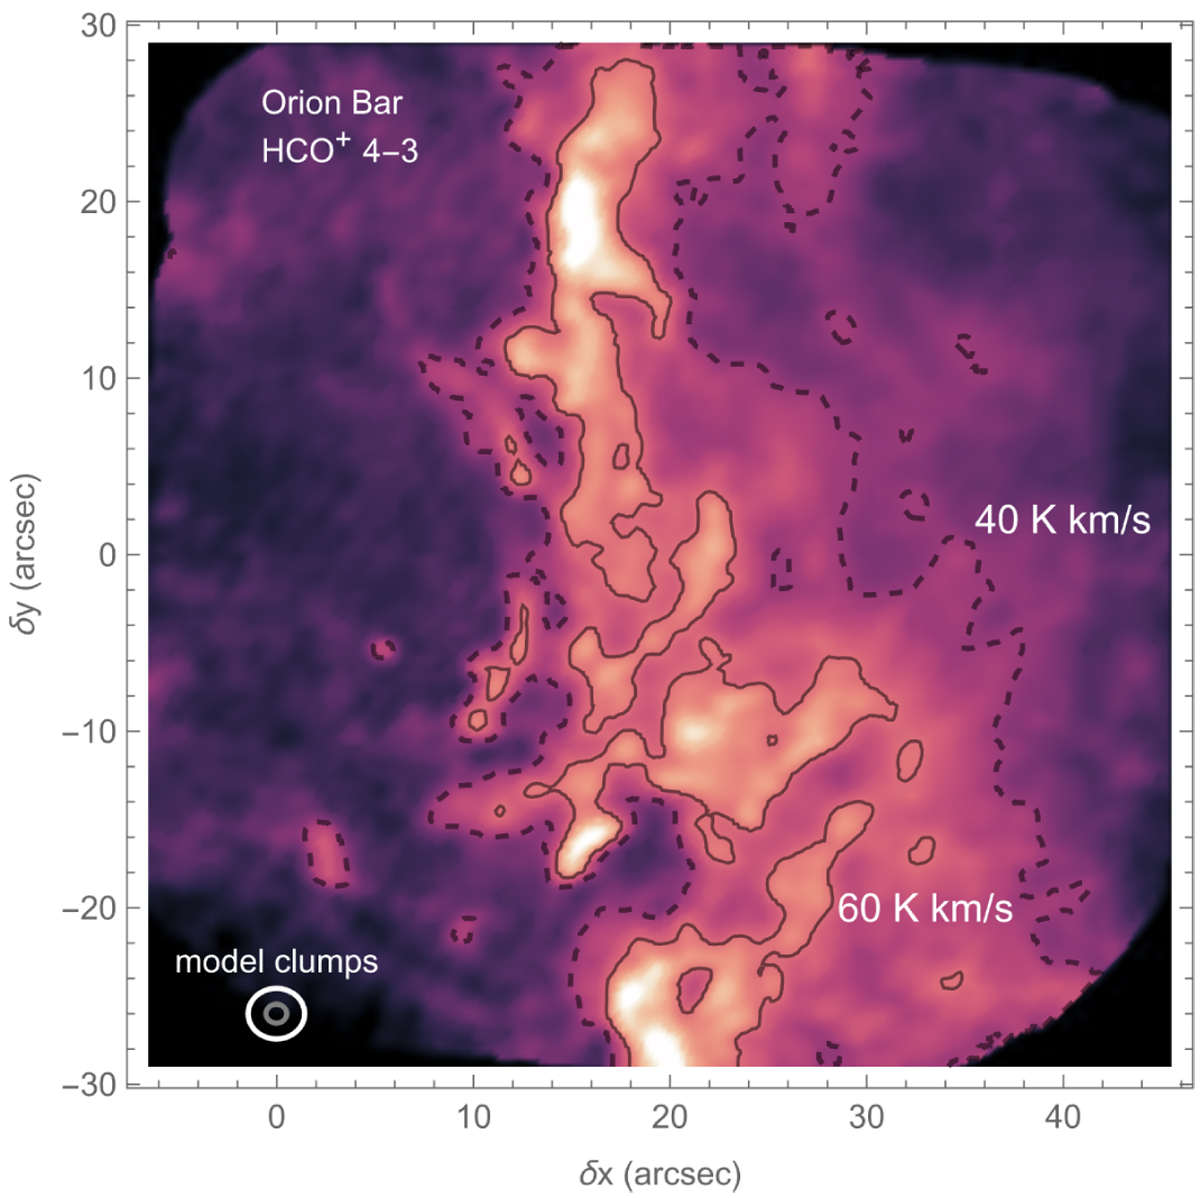
Integrated intensity map of the HCO+ 4−3 line emission in the Orion Bar (see Goicoechea et al. 2016, for details on the mapped area). The contours corresponds to integrated intensities of 40 K km s−1 (dashed) and 60 K km s−1 (solid). The colors indicate intensities between 0 and 100 K km s−1. The two circles in the lower left show the area of clumps with M = 0.01 M⊙ (white) and M = 0.001 M⊙ (gray).
Current usage metrics show cumulative count of Article Views (full-text article views including HTML views, PDF and ePub downloads, according to the available data) and Abstracts Views on Vision4Press platform.
Data correspond to usage on the plateform after 2015. The current usage metrics is available 48-96 hours after online publication and is updated daily on week days.
Initial download of the metrics may take a while.