Fig. C.1
Download original image
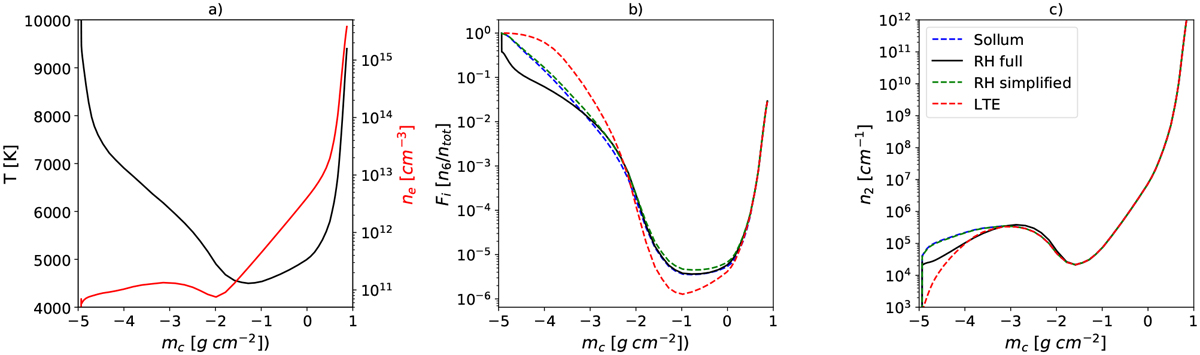
Statistical equilibrium populations of hydrogen, comparing the Sollum radiative rates with a detailed calculation using the RH code. Panel (a) shows the temperature and electron density of the FAL-C atmosphere. Panel (b) compares the ionisation fraction and panel (c) the n2 populations. These are shown for LTE (dashed red lines) and the Sollum radiative rates (dashed blue lines) as well as from two detailed calculations with the RH code, one that treats Lyman lines in detailed balance (dashed green lines) and a second that calculates the radiative rates for the Lyman lines (solid black lines; see the legend in panel c).
Current usage metrics show cumulative count of Article Views (full-text article views including HTML views, PDF and ePub downloads, according to the available data) and Abstracts Views on Vision4Press platform.
Data correspond to usage on the plateform after 2015. The current usage metrics is available 48-96 hours after online publication and is updated daily on week days.
Initial download of the metrics may take a while.