Open Access
Fig. 7
Download original image
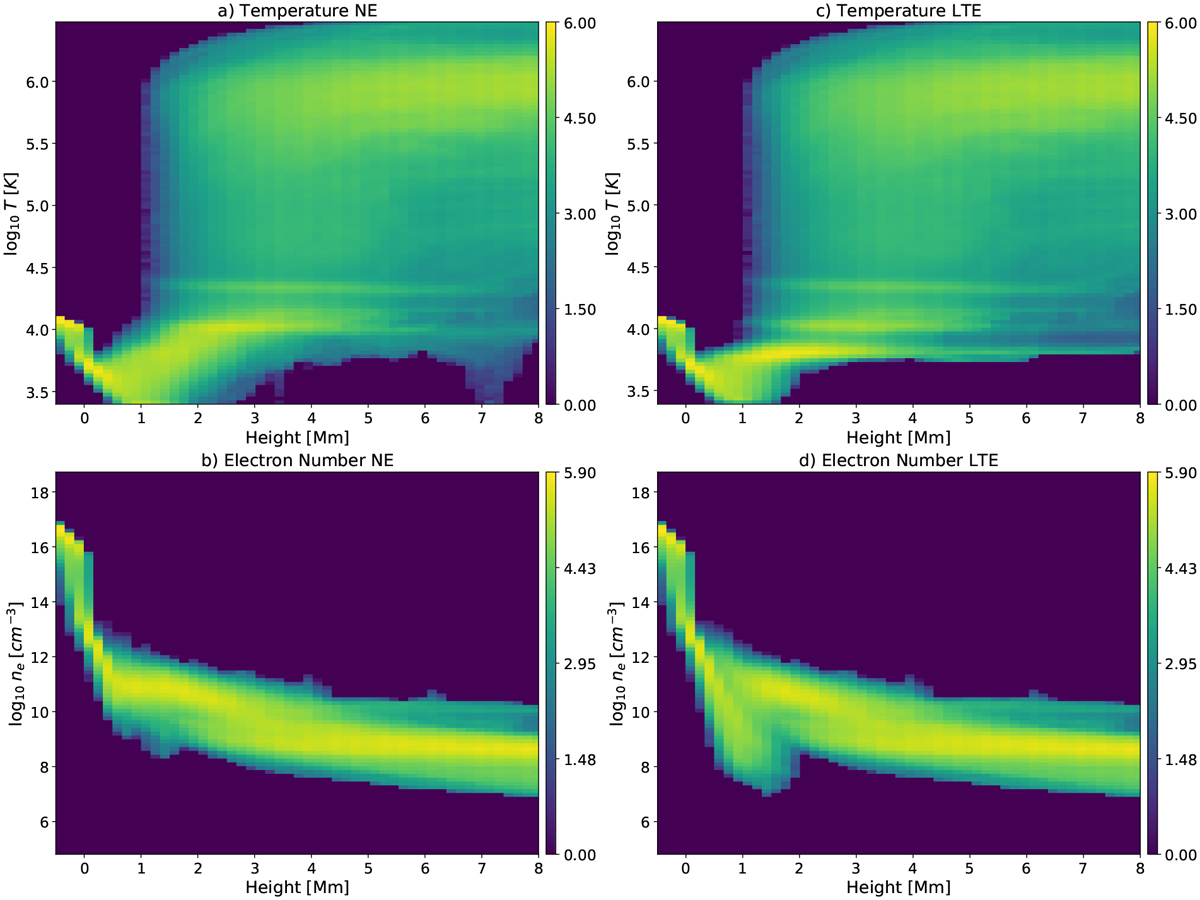
Histograms of the temperature (top) and electron number (bottom) throughout the photosphere and chromosphere of the simulation. We compare the NE values (left columns) with those obtained from the pre-tabulated LTE EoS (right columns).
Current usage metrics show cumulative count of Article Views (full-text article views including HTML views, PDF and ePub downloads, according to the available data) and Abstracts Views on Vision4Press platform.
Data correspond to usage on the plateform after 2015. The current usage metrics is available 48-96 hours after online publication and is updated daily on week days.
Initial download of the metrics may take a while.