Fig. 4
Download original image
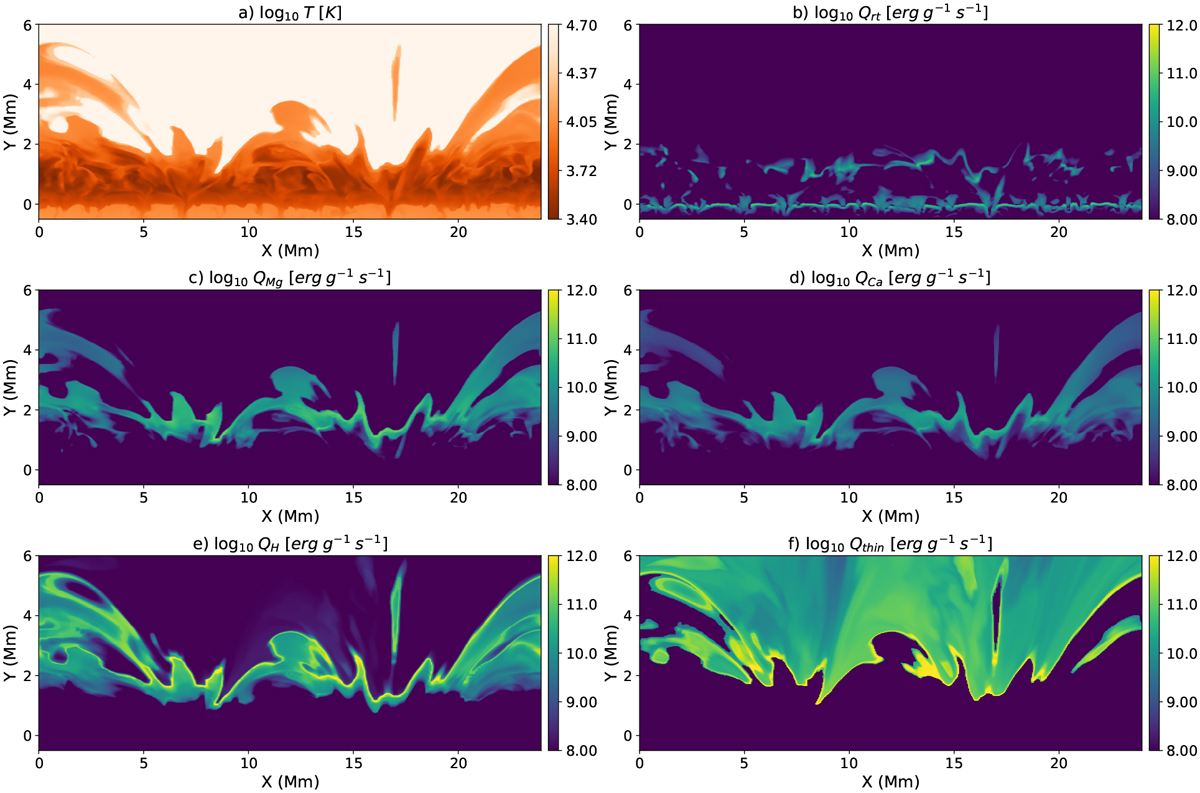
Radiative cooling in the photosphere and chromosphere for a slice through the simulation. Panel a shows the temperature, and panel b shows the losses through the three-dimensional multi-group radiation transport scheme. The chromospheric line losses are shown for magnesium, calcium, and hydrogen in panels c, d, and e, respectively. Panel f shows the optically thin losses in the corona.
Current usage metrics show cumulative count of Article Views (full-text article views including HTML views, PDF and ePub downloads, according to the available data) and Abstracts Views on Vision4Press platform.
Data correspond to usage on the plateform after 2015. The current usage metrics is available 48-96 hours after online publication and is updated daily on week days.
Initial download of the metrics may take a while.