Fig. 2
Download original image
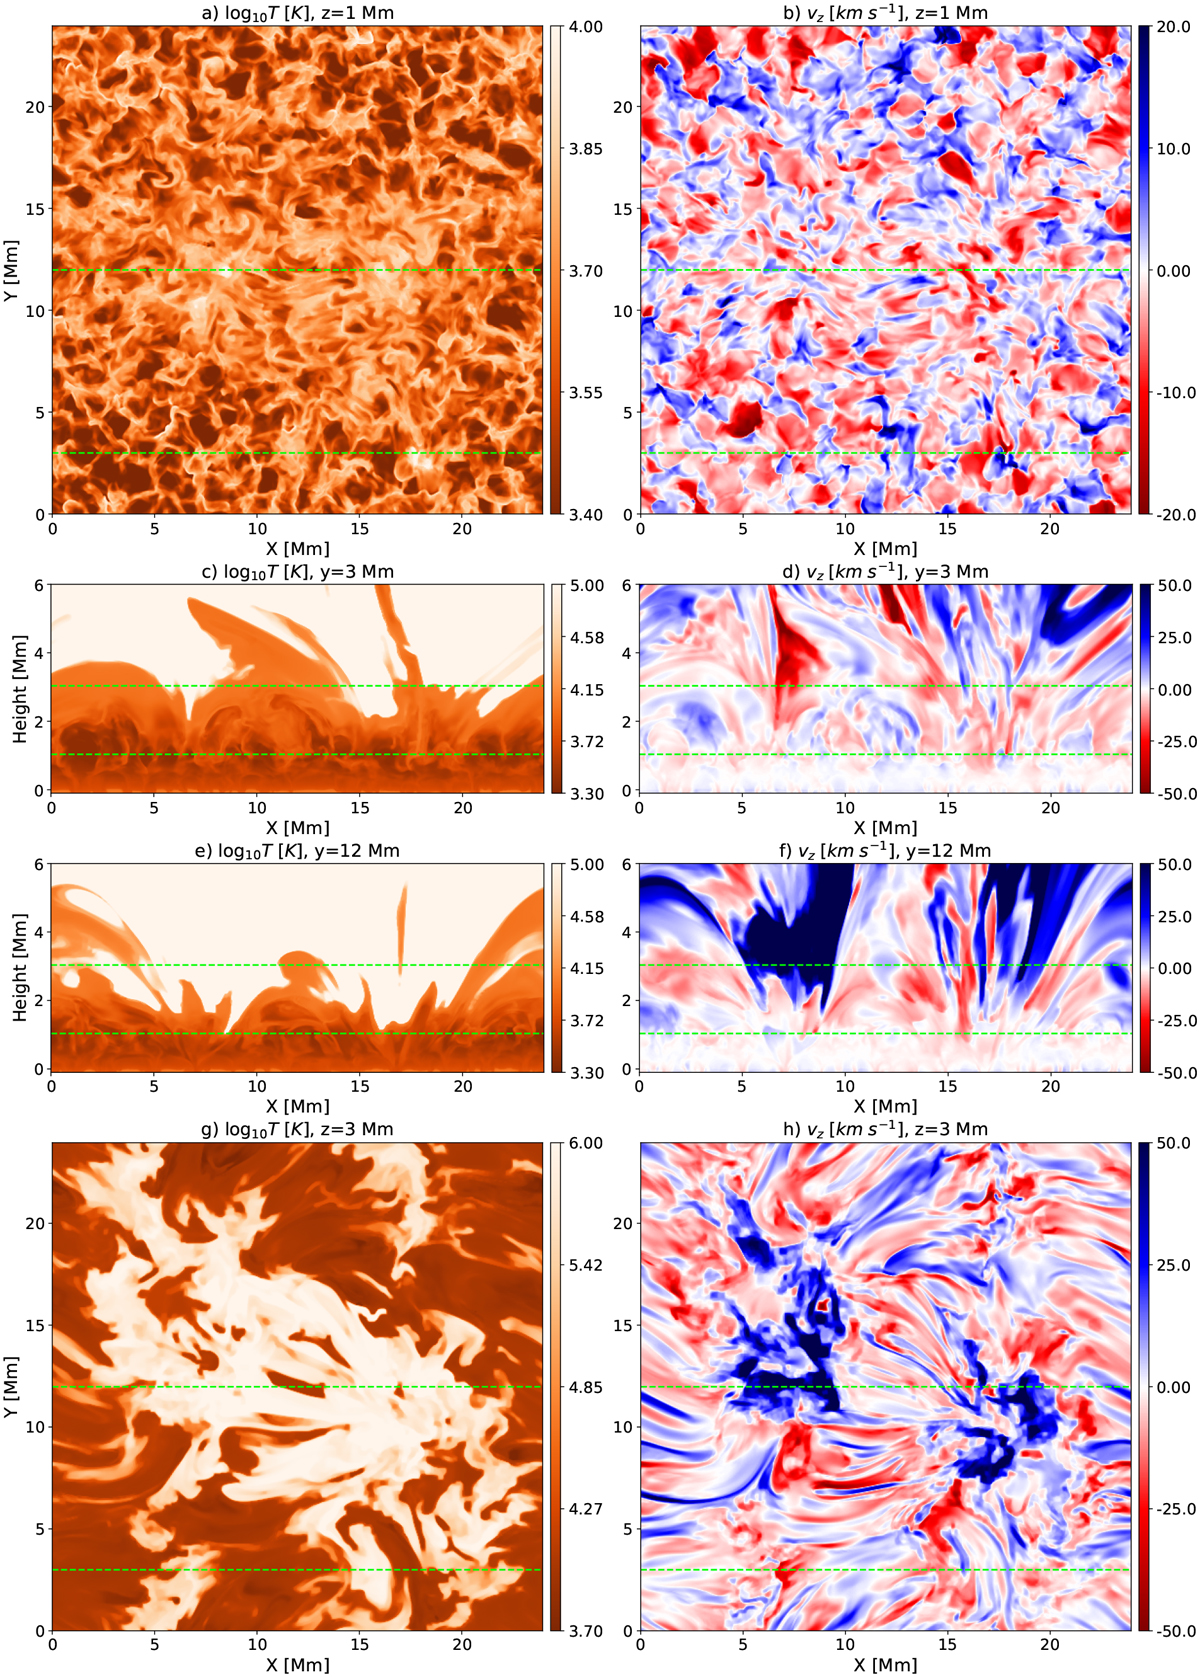
Slices through the chromosphere after 3850 s of the simulation, showing temperature in the left column and vertical velocity in the right column. Slices in the horizontal plane are taken through the low chromosphere (panels a and b) and the upper chromosphere (panels ɡ and h). The middle rows show vertical slices through a quieter inter-network region (panels c and d) and through the centre of the network field (panels e and f). An animation is available online.
Current usage metrics show cumulative count of Article Views (full-text article views including HTML views, PDF and ePub downloads, according to the available data) and Abstracts Views on Vision4Press platform.
Data correspond to usage on the plateform after 2015. The current usage metrics is available 48-96 hours after online publication and is updated daily on week days.
Initial download of the metrics may take a while.