Fig. 1
Download original image
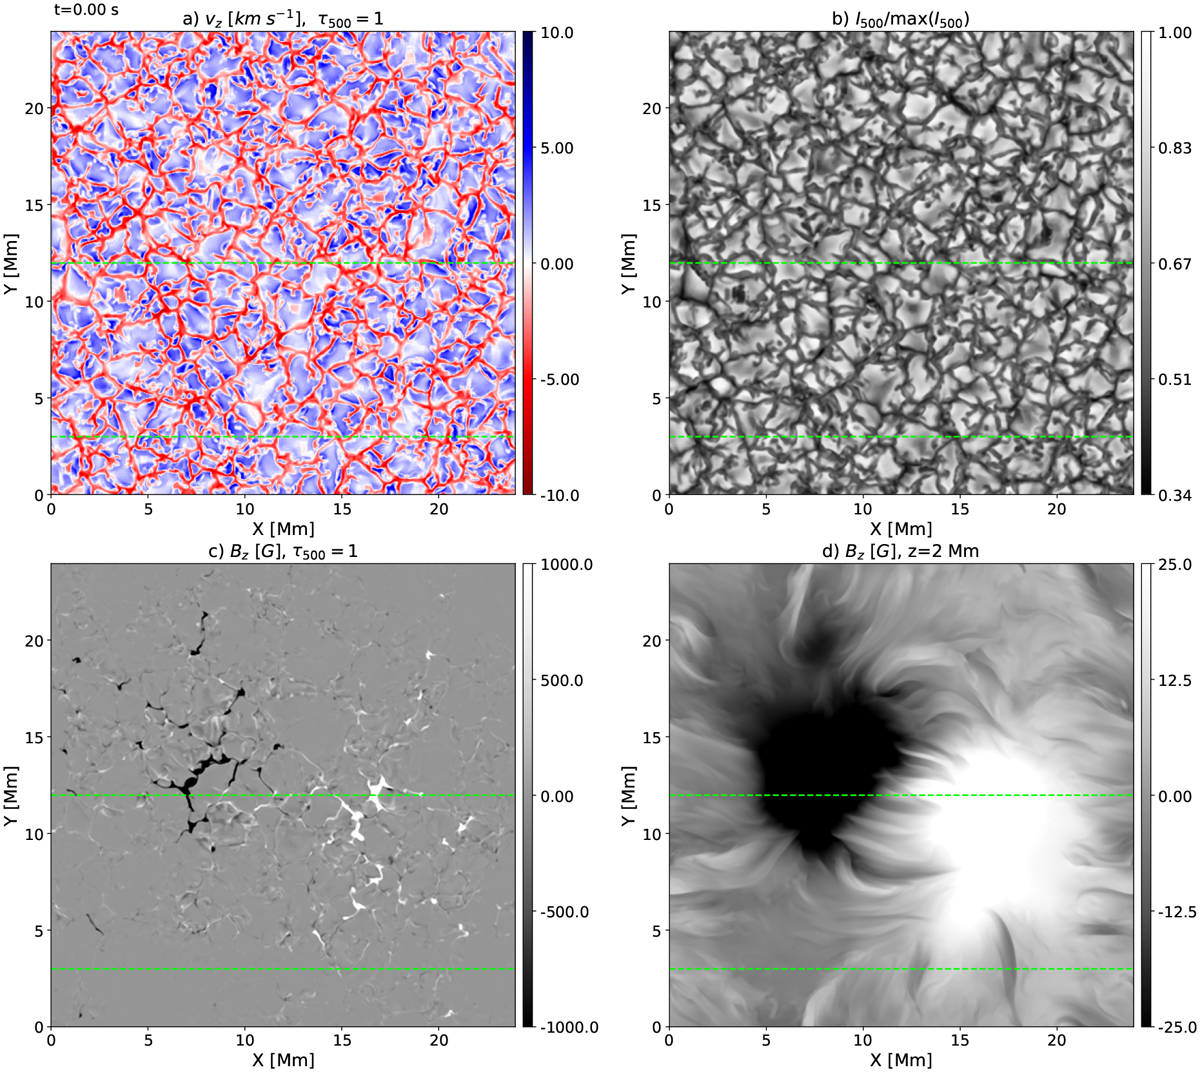
Snapshot of the simulation after 3850 s, showing: the vertical velocity at the photosphere (panel a) the normalised intensity at 500 nm (panel b), the vertical magnetic field at the photosphere (panel c), and the vertical magnetic field at a height of 2 Mm in the chromosphere (panel d). The dashed green lines show the slices taken in Fig. 2. Panels c and d have been saturated in order to show the fine structure of the magnetic field. Slices at the photosphere are taken at the contour where τ500 = 1.
Current usage metrics show cumulative count of Article Views (full-text article views including HTML views, PDF and ePub downloads, according to the available data) and Abstracts Views on Vision4Press platform.
Data correspond to usage on the plateform after 2015. The current usage metrics is available 48-96 hours after online publication and is updated daily on week days.
Initial download of the metrics may take a while.