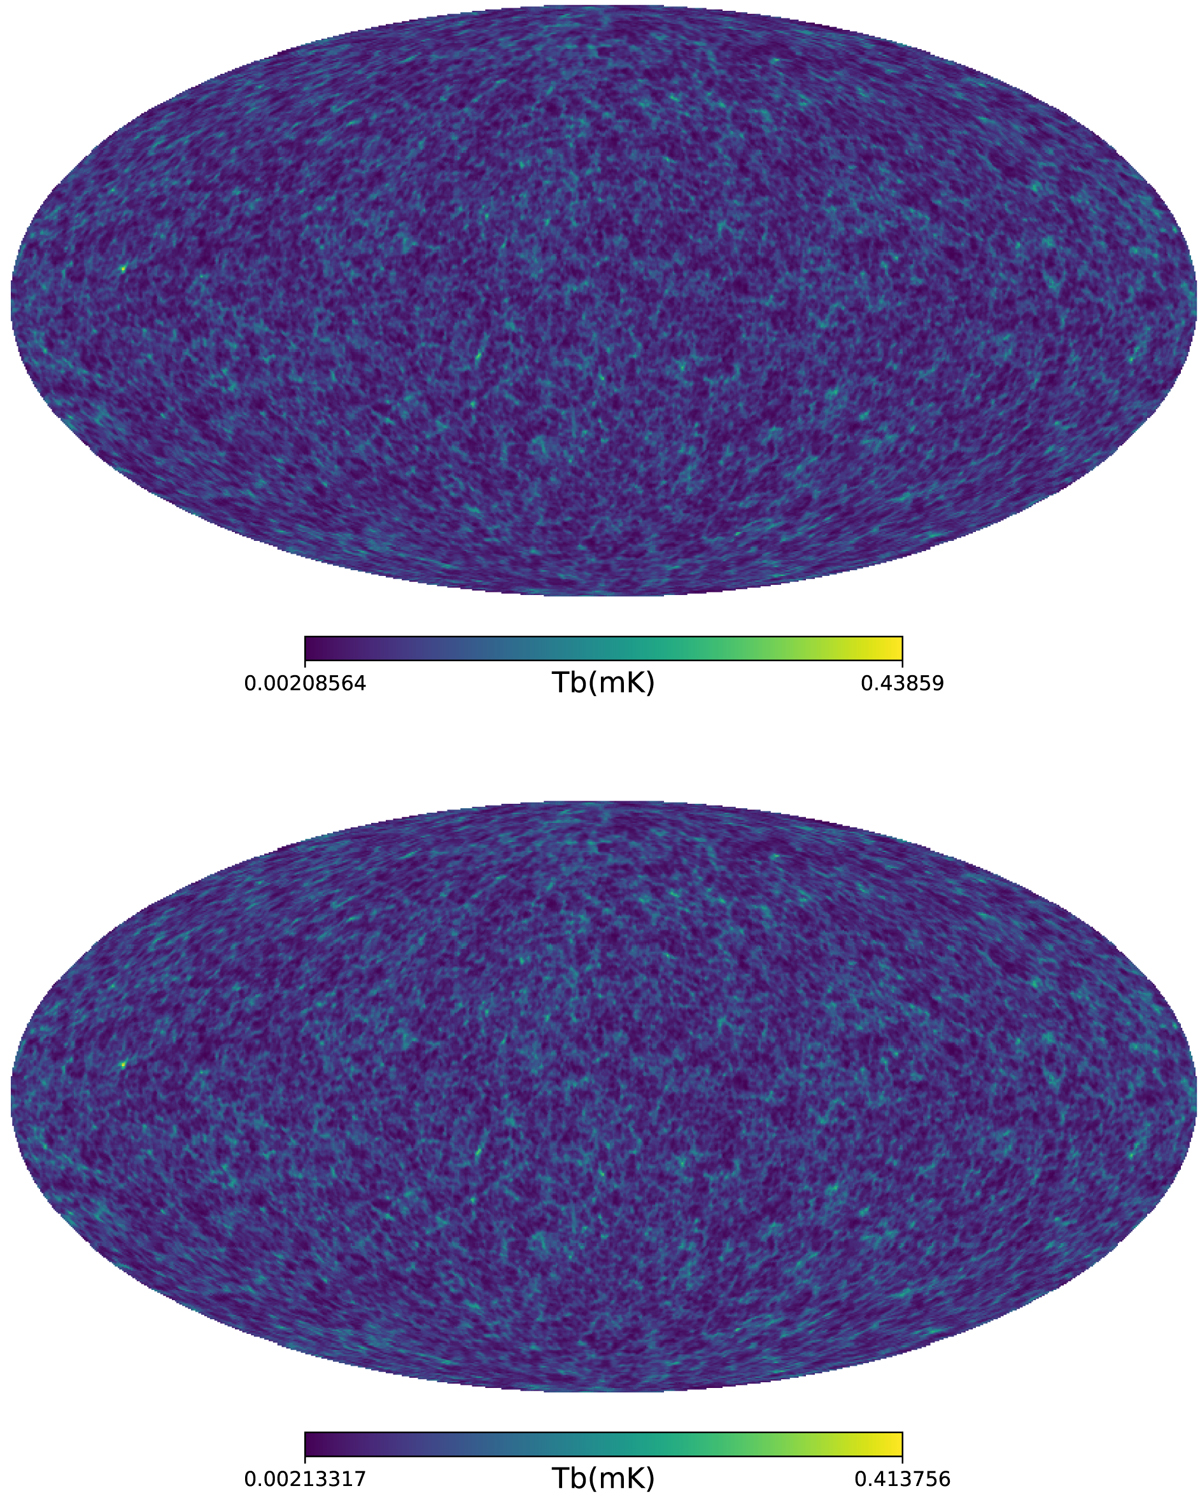
Fig. 9.
Download original image
Mollweide projection of the brightness temperature map using the HOD method to populate H I gas in halos in redshift space from 990 MHz to 1000 MHz. We only considered the velocity of halos as a point source in the upper panel, which mainly only contains Kaiser effect. Lower panel: we considered the velocity dispersion of H I gas in the sources, which means that the FoG effect is taken into account.
Current usage metrics show cumulative count of Article Views (full-text article views including HTML views, PDF and ePub downloads, according to the available data) and Abstracts Views on Vision4Press platform.
Data correspond to usage on the plateform after 2015. The current usage metrics is available 48-96 hours after online publication and is updated daily on week days.
Initial download of the metrics may take a while.