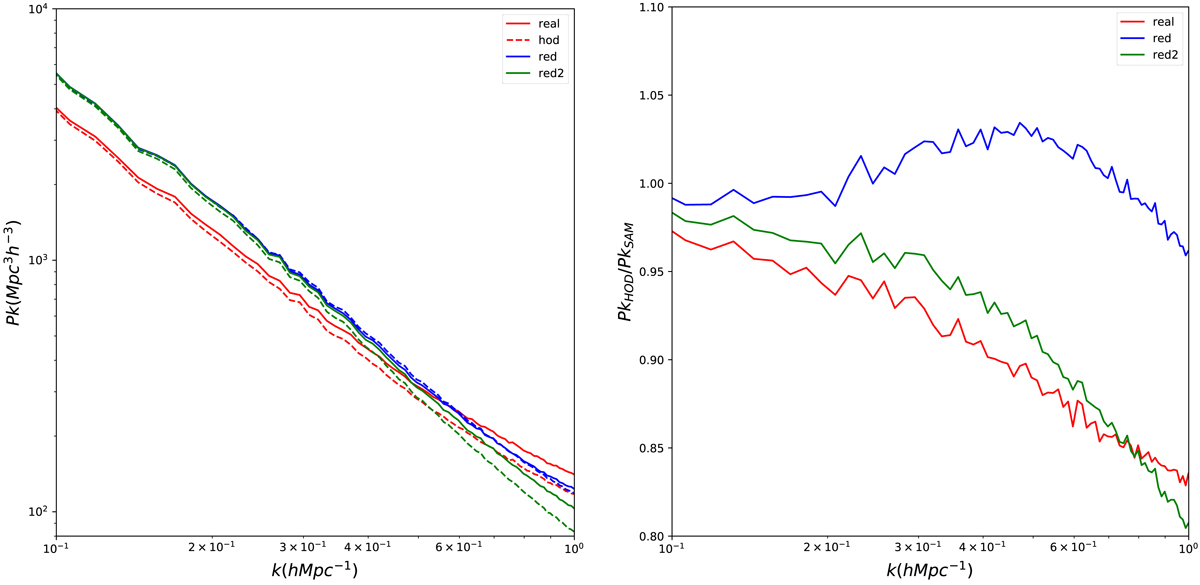
Fig. 6.
Download original image
Comparison of the power spectrum of the HOD model and the SAM catalog. On the left, we show the H I power spectrum. The solid lines represent the power spectrum measured from the SAM galaxy catalog, and the dashed lines represent the power spectrum measured from the HOD model. “Real” means the real-space point-mass power spectrum, “red” means the redshift-space point-mass power spectrum, and “red2” means the redshift-space inside the galaxy H I distribution modeled power spectrum (Zhang et al. 2020). On the right, we show the power spectrum ratio of the results of the HOD model and the SAM galaxy catalog.
Current usage metrics show cumulative count of Article Views (full-text article views including HTML views, PDF and ePub downloads, according to the available data) and Abstracts Views on Vision4Press platform.
Data correspond to usage on the plateform after 2015. The current usage metrics is available 48-96 hours after online publication and is updated daily on week days.
Initial download of the metrics may take a while.