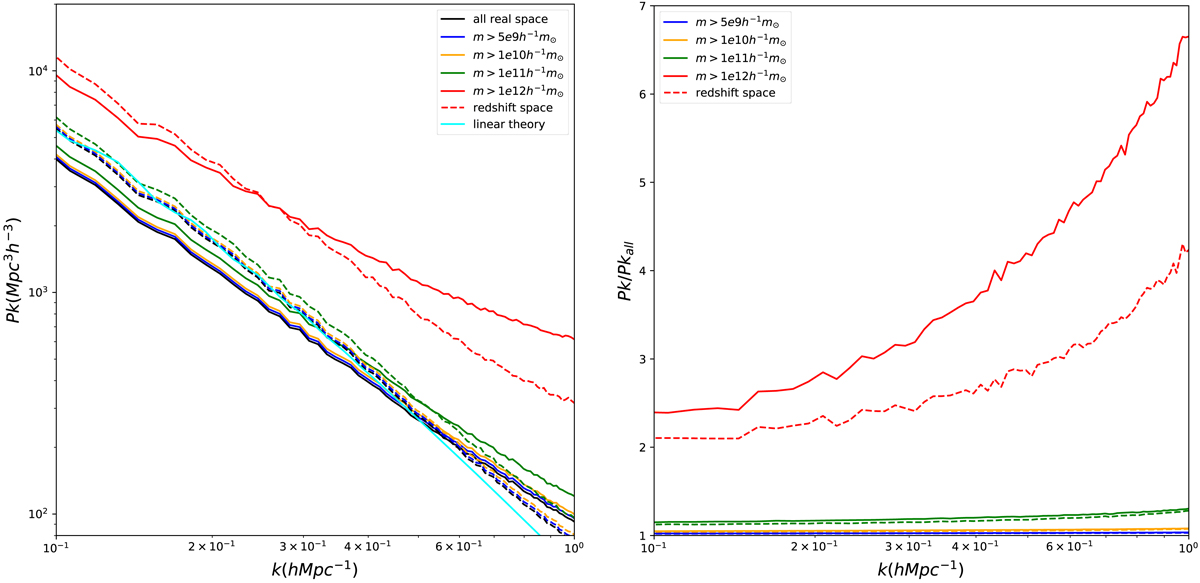
Fig. 5.
Download original image
Comparison of power spectrum with different halo mass threshold. On the left, we show the H I power spectrum. On the right, we show the ratio of the power spectrum of the sample with a halo mass threshold and the full sample. The solid curves show the results in real space and the dashed curves show the results in redshift space. Different colors denote different samples with different thresholds. We also include the linear matter power spectrum for reference in cyan color on the left.
Current usage metrics show cumulative count of Article Views (full-text article views including HTML views, PDF and ePub downloads, according to the available data) and Abstracts Views on Vision4Press platform.
Data correspond to usage on the plateform after 2015. The current usage metrics is available 48-96 hours after online publication and is updated daily on week days.
Initial download of the metrics may take a while.