Fig. 3.
Download original image
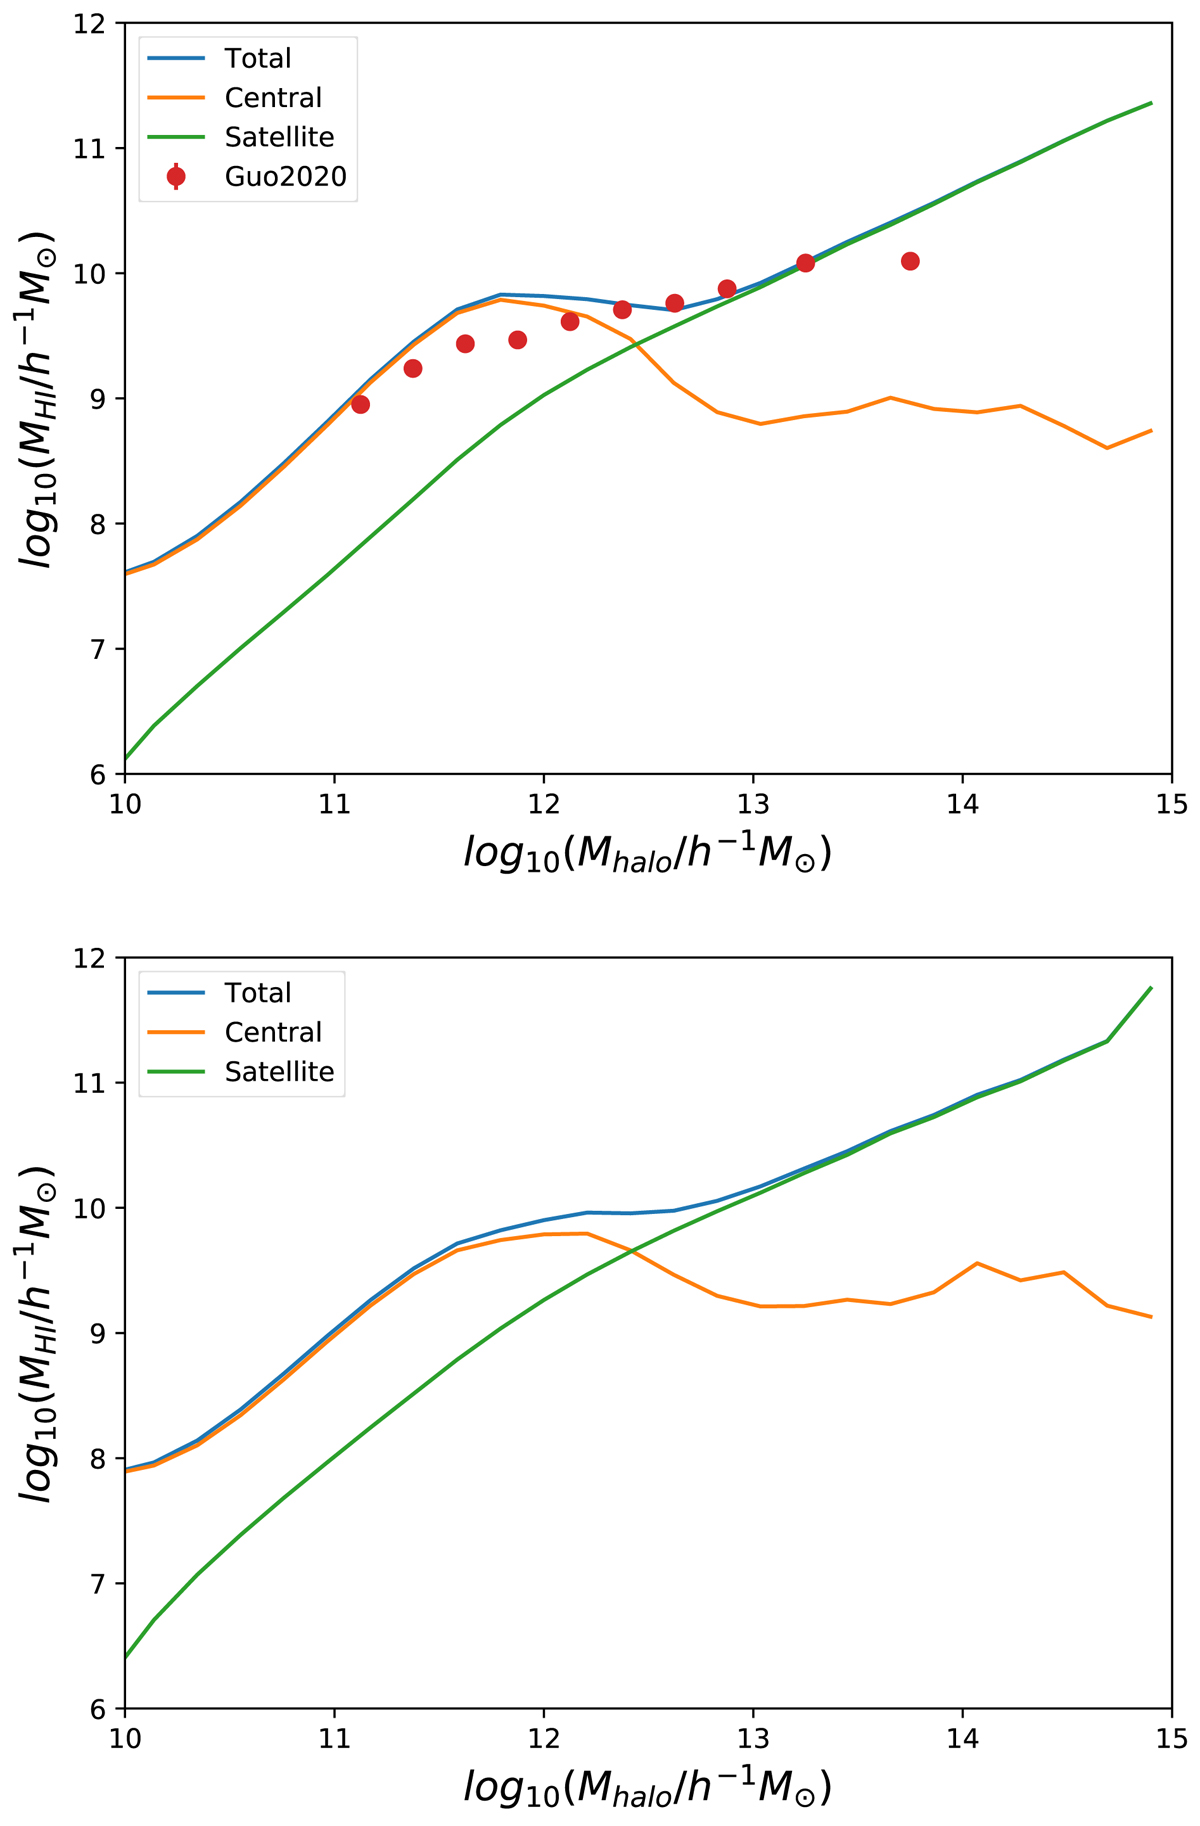
H I mass-halo mass relation at two different redshifts. Upper (lower) panel: H I mass-halo mass relation at z = 0(0.66). The total H I mass is shown as a blue curve, the contribution from central galaxies is shown in orange and the contribution from satellite galaxies is shown in green. Regardless of whether it is at z = 0 or 0.66, the central galaxy always contributes the most H I mass to low-mass halos, and satellite galaxies contribute most of the H I mass in high-mass halos. We also show the observed H I mass-halo mass relation as red dots at z = 0 (Guo et al. 2020) for comparison.
Current usage metrics show cumulative count of Article Views (full-text article views including HTML views, PDF and ePub downloads, according to the available data) and Abstracts Views on Vision4Press platform.
Data correspond to usage on the plateform after 2015. The current usage metrics is available 48-96 hours after online publication and is updated daily on week days.
Initial download of the metrics may take a while.