Free Access
Fig. 20.
Download original image
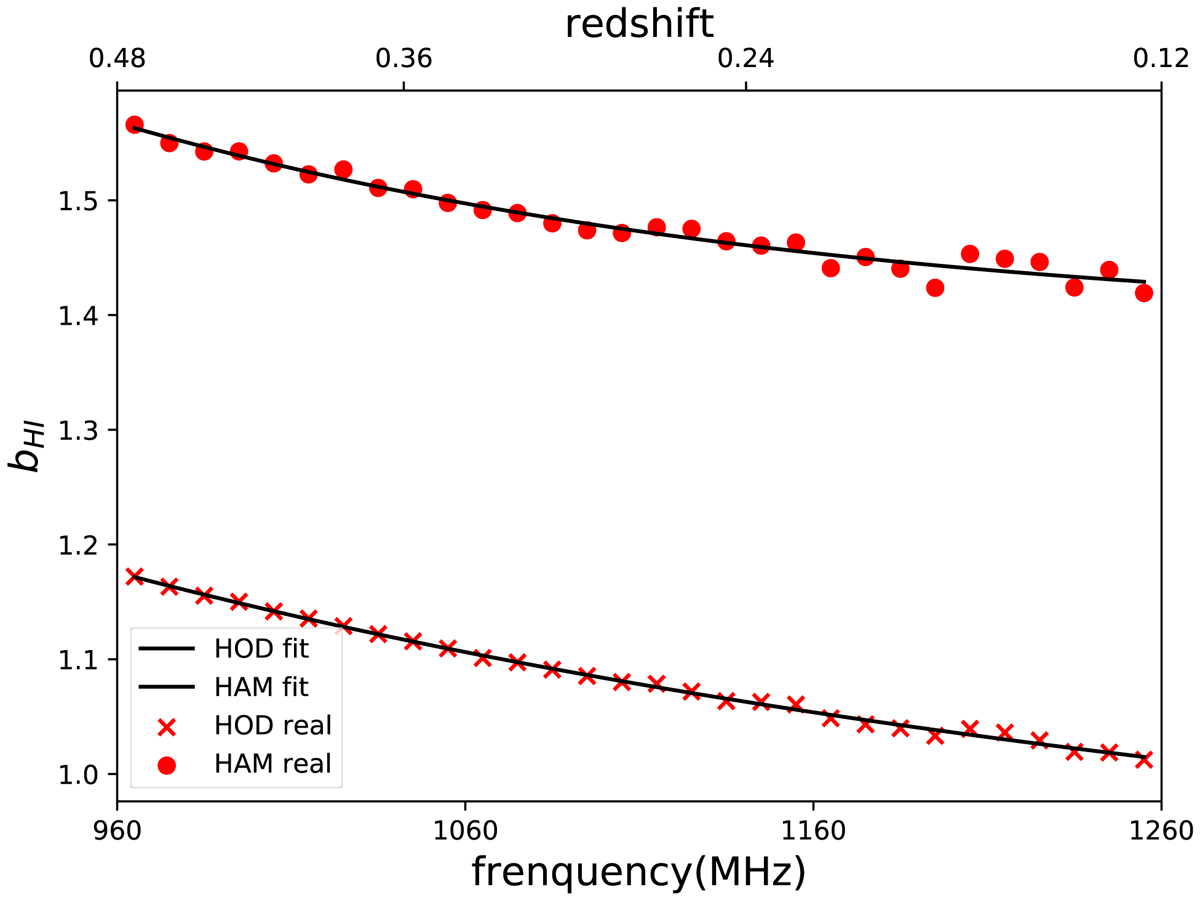
bHi as a function of frequency (redshift) in our mock map. The crosses show the result of the HOD mock and the dots show the result of the HAM mock. The real-space and redshift-space mock bias are measured, and they are almost identical. The solid black lines show the parabola fitting results.
Current usage metrics show cumulative count of Article Views (full-text article views including HTML views, PDF and ePub downloads, according to the available data) and Abstracts Views on Vision4Press platform.
Data correspond to usage on the plateform after 2015. The current usage metrics is available 48-96 hours after online publication and is updated daily on week days.
Initial download of the metrics may take a while.