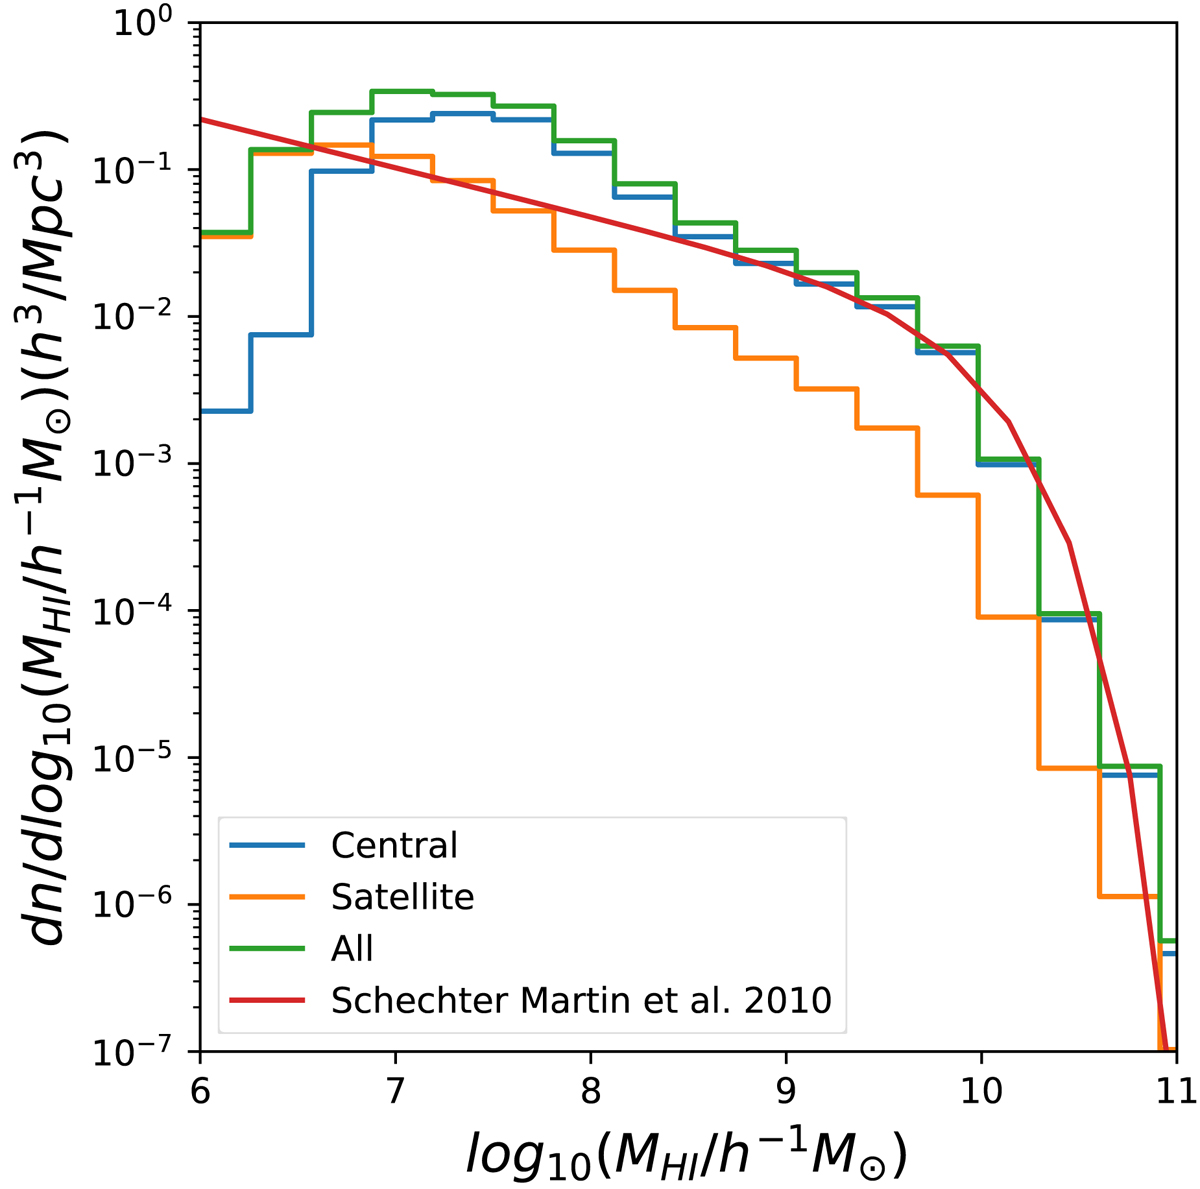
Fig. 2.
Download original image
H I mass function measured from the ELUCID SAM catalog at z = 0. The result of central (satellite) galaxy is shown in blue (orange), and the total result is shown in green. The red curve shows the Schechter function provided by Martin et al. (2010), which represents the fitting function of ALFALFA observation. Overall, the H I mass function between the SAM and observation is consistent.
Current usage metrics show cumulative count of Article Views (full-text article views including HTML views, PDF and ePub downloads, according to the available data) and Abstracts Views on Vision4Press platform.
Data correspond to usage on the plateform after 2015. The current usage metrics is available 48-96 hours after online publication and is updated daily on week days.
Initial download of the metrics may take a while.