Fig. 18.
Download original image
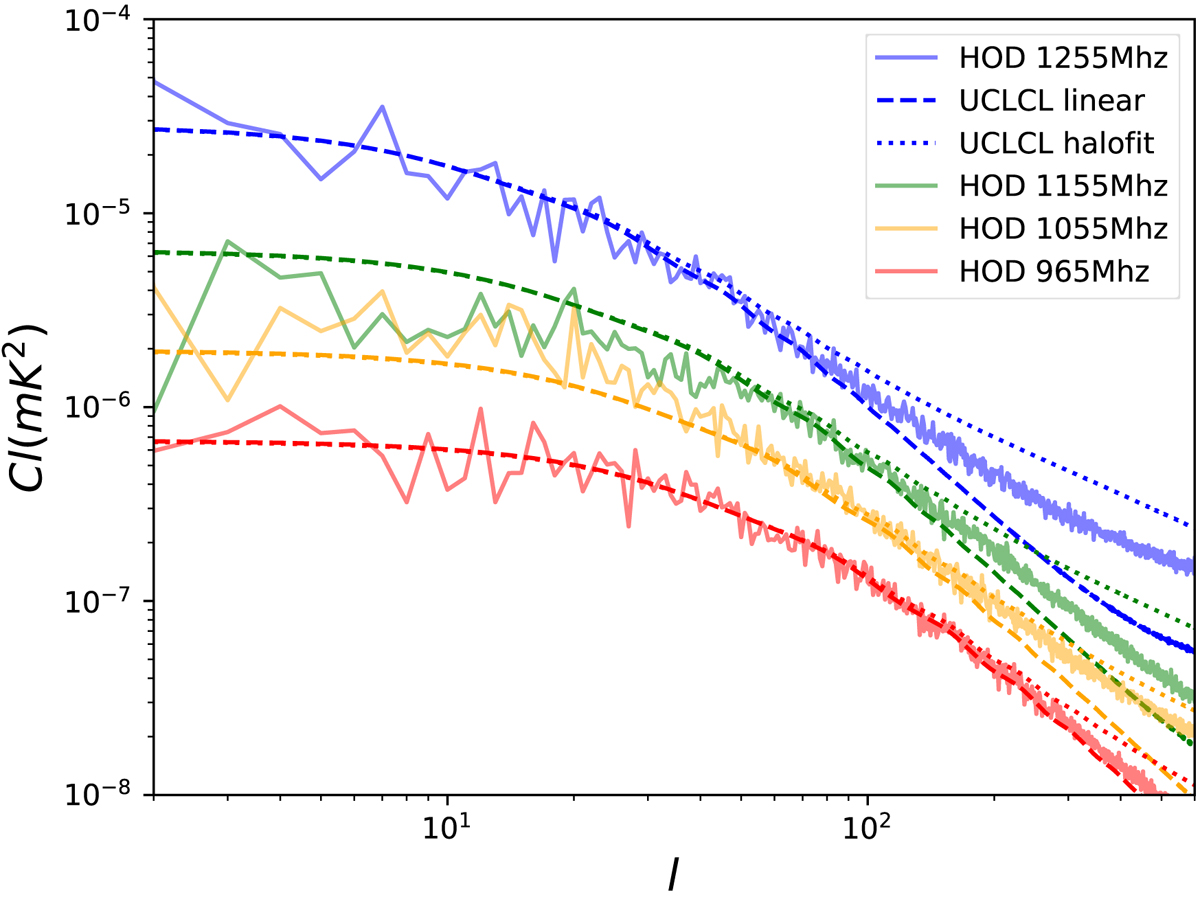
Angular power spectrum of the HOD mocks (solid faint curves) compared to the calculation with the UCLCl code with a linear calculation (dashed lines) and halofit nonlinear correction (dotted lines) in redshift space. Red (orange, green, and blue) lines show the result from 960 (1050, 1150, and 1160) MHz to 970 (1060, 1160, and 1260) MHz, averaged at 965 (1055, 1155, and 1255) MHz, which are amplified by 0.25 (0.5, 1, and 2) times for better illustration. HOD mock measurements are higher than the linear calculation, but lower than the halofit calculation at small scales.
Current usage metrics show cumulative count of Article Views (full-text article views including HTML views, PDF and ePub downloads, according to the available data) and Abstracts Views on Vision4Press platform.
Data correspond to usage on the plateform after 2015. The current usage metrics is available 48-96 hours after online publication and is updated daily on week days.
Initial download of the metrics may take a while.