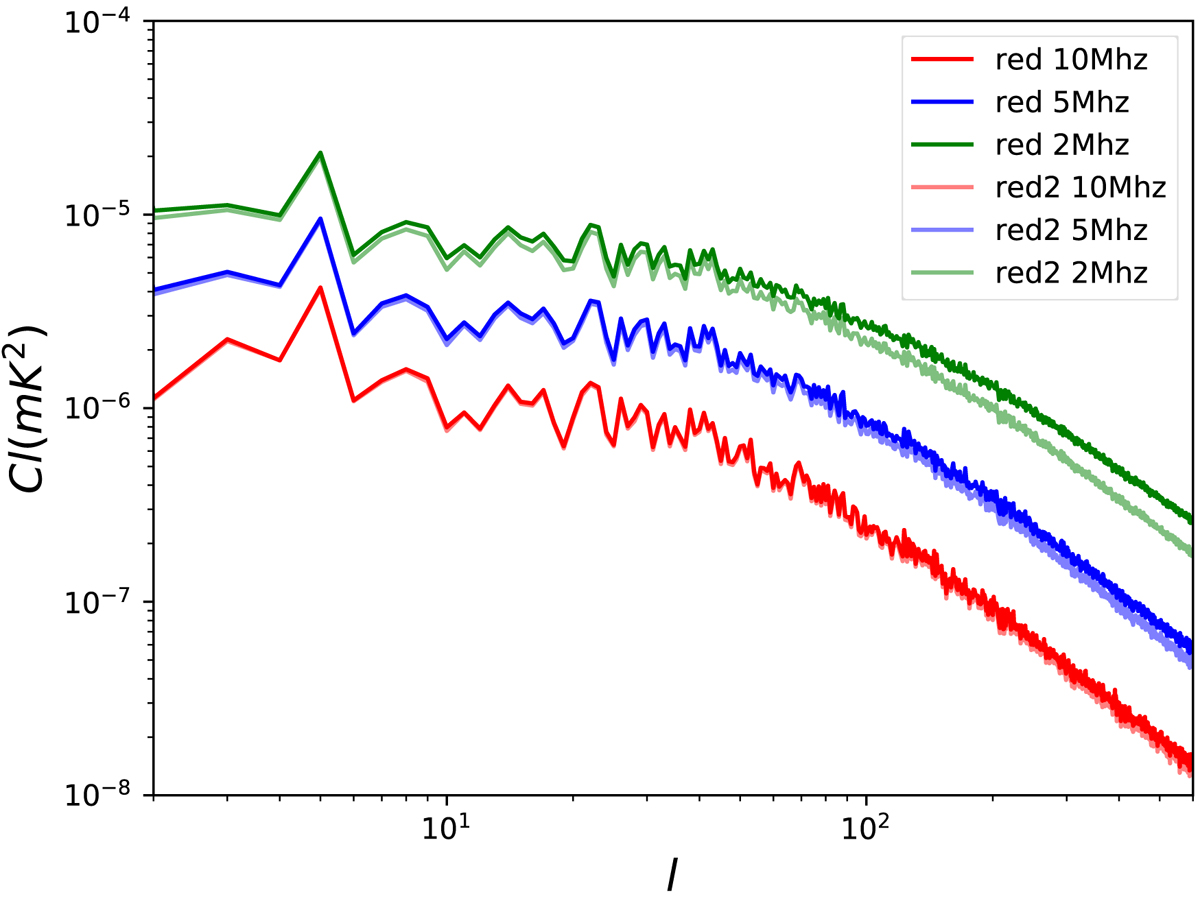
Fig. 17.
Download original image
Comparison of the red (point-source assumption) HOD mock and the red2 (velocity dispersion induced FoG effect modeled) HOD mock shown with 10 (5 and 2) MHz in red (blue and green). The red results are shown as thick solid lines, and the red2 results are shown as faint solid lines. For better illustration, we artificially amplified the curves by 0.5 (1 and 2) times for 10 (5 and 2) MHz results. The FoG suppression at small scales is clearer with a smaller bin width.
Current usage metrics show cumulative count of Article Views (full-text article views including HTML views, PDF and ePub downloads, according to the available data) and Abstracts Views on Vision4Press platform.
Data correspond to usage on the plateform after 2015. The current usage metrics is available 48-96 hours after online publication and is updated daily on week days.
Initial download of the metrics may take a while.