Fig. 15.
Download original image
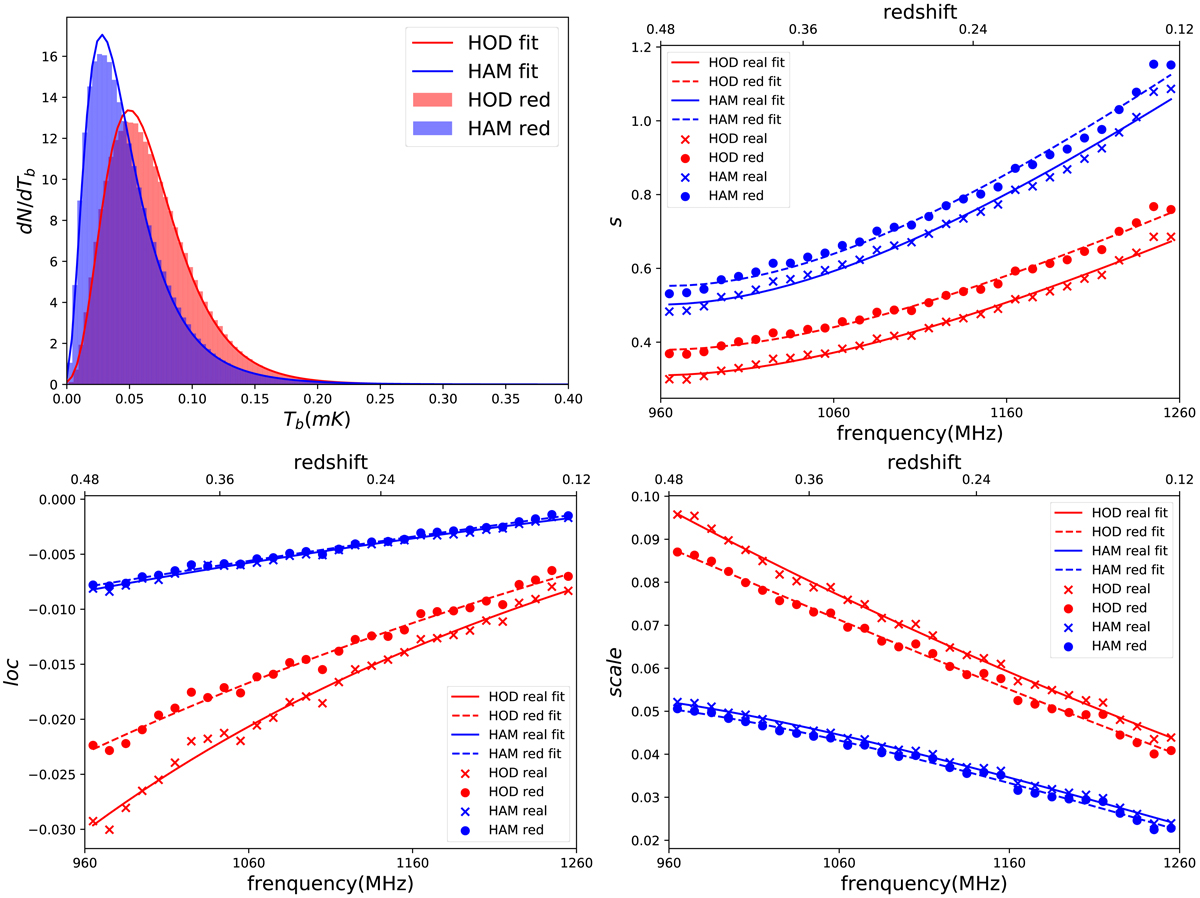
Pixel histogram of the brightness temperature distribution and related lognormal fitting results. Upper left panel: histogram of the pixels of the brightness temperature distribution of the redshift-space mock map from 990 MHz to 1000 MHz smoothed by a 40 arcmin Gaussian kernel. After smoothing, the histogram can be very well fit by the lognormal distribution. The fitted parameters, s, loc, and scale, are shown as a function of the redshift (frequency) in the other three panels. For each of them we also fit a parabola function, which is a good fit. The lognormal fitted parameters are shown in red for the HOD mock and in blue for the HAM mock. Crosses represent the real-space mock and dots the redshift-space mock. The parabola fitting curves are shown in red for the HOD mock and in blue for the HAM mock. Solid lines show the real-space mock, and dashed lines show the redshift-space mock.
Current usage metrics show cumulative count of Article Views (full-text article views including HTML views, PDF and ePub downloads, according to the available data) and Abstracts Views on Vision4Press platform.
Data correspond to usage on the plateform after 2015. The current usage metrics is available 48-96 hours after online publication and is updated daily on week days.
Initial download of the metrics may take a while.