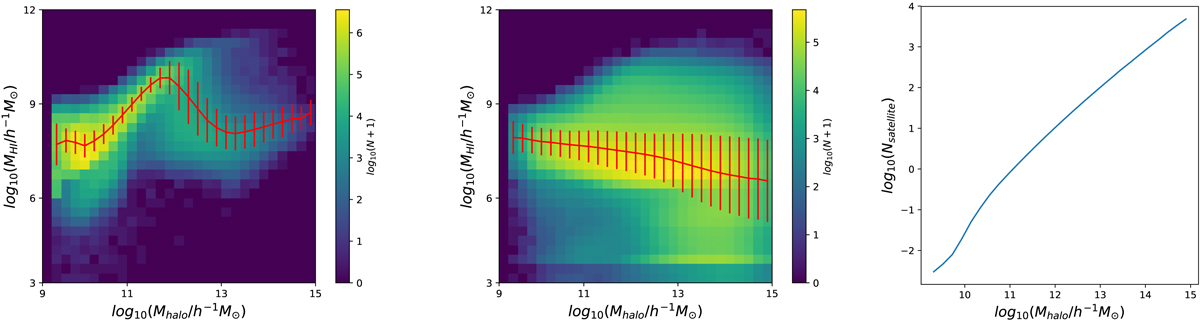
Fig. 1.
Download original image
Number of galaxies as a function of their host halo mass and H I mass in the ELUCID SAM catalog. The number in logarithmic scale is represented by different colors. We show the result of central (satellite) galaxies in the left (middle) panel. The mean value and standard deviation are shown together with the color map to illustrate the trend more clearly. The average number of satellite galaxies in each halo as a function of mass is shown in the right panel.
Current usage metrics show cumulative count of Article Views (full-text article views including HTML views, PDF and ePub downloads, according to the available data) and Abstracts Views on Vision4Press platform.
Data correspond to usage on the plateform after 2015. The current usage metrics is available 48-96 hours after online publication and is updated daily on week days.
Initial download of the metrics may take a while.