Fig. 8

Download original image
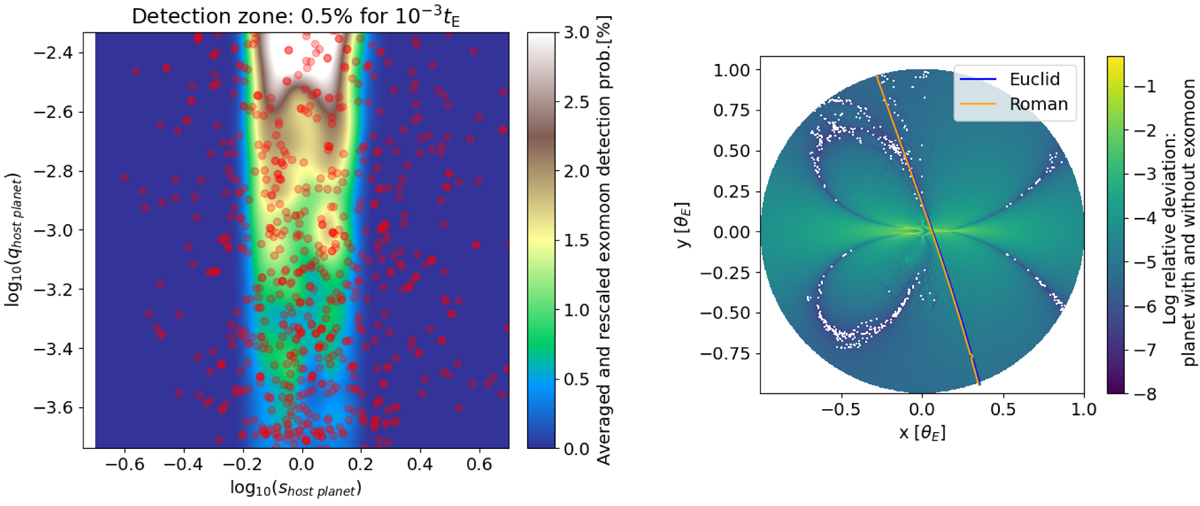
Simulated detection zone areas converted to assess probability for exomoons around host stars (red dots) assuming a detection threshold of 0.5%, corresponding to 5 mmag accuracy for unblended events, well within the expectation of the Roman telescopes. In order to account for the sampling interval consecutive points should be within 10−3tE to be detectable. For more massive planets (green) the detection zone is expected to cover 10−3 ![]() . For reference, the Einstein radius of an isolated exomoon with q2 = 10−5 would be roughly 10−3 smaller than the Einstein radius of the host star. A representative sample of planets detected by Roman (Penny et al. 2019) is used to assess the number of detectable exomoons. In addition, the logarithmic relative deviation and simulated tracks are shown for both missions for illustrative purposes.
. For reference, the Einstein radius of an isolated exomoon with q2 = 10−5 would be roughly 10−3 smaller than the Einstein radius of the host star. A representative sample of planets detected by Roman (Penny et al. 2019) is used to assess the number of detectable exomoons. In addition, the logarithmic relative deviation and simulated tracks are shown for both missions for illustrative purposes.
Current usage metrics show cumulative count of Article Views (full-text article views including HTML views, PDF and ePub downloads, according to the available data) and Abstracts Views on Vision4Press platform.
Data correspond to usage on the plateform after 2015. The current usage metrics is available 48-96 hours after online publication and is updated daily on week days.
Initial download of the metrics may take a while.


