Fig. 5

Download original image
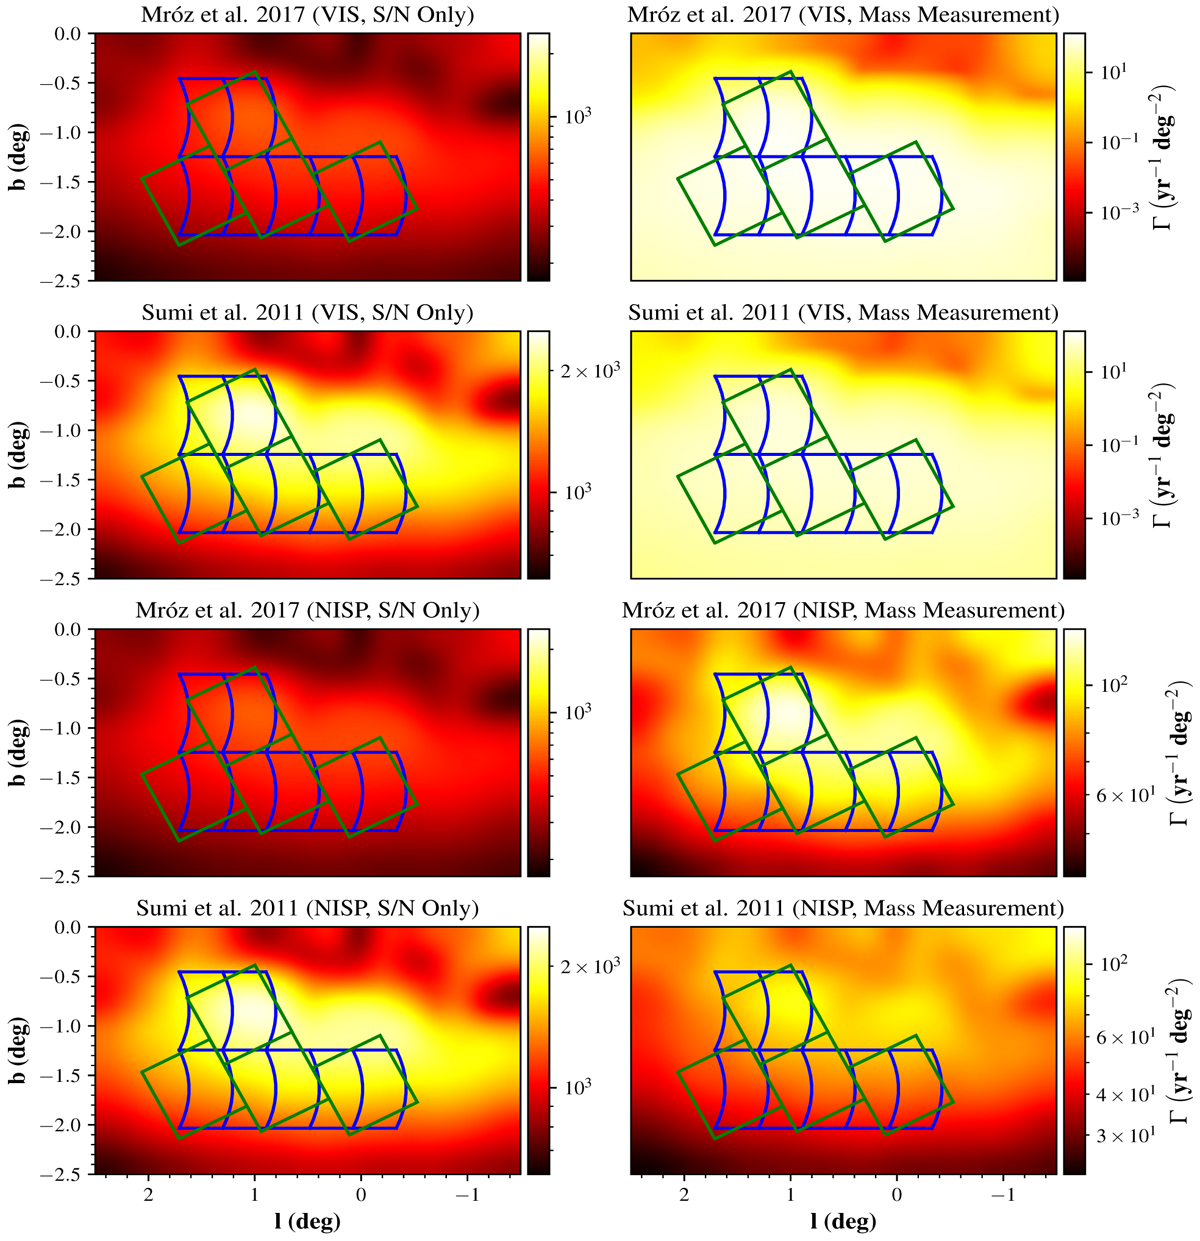
FFP rate maps, in units of events per square degree per year, for events jointly detected by the Roman W146 filter and Euclid VIS filters (top two rows) and by the NISP filter (bottom two rows). Rows 1 and 3 use the Mróz model of ten Earth-mass FFPs per main sequence star, while rows 2 and 4 use the Sumi model of two Jupiter-mass FFPs per main sequence star. The left column shows rate maps constrained only by the S/N criterion, while the right column shows the equivalent rate maps with all selection criteria present, including parallax and finite source effects.
Current usage metrics show cumulative count of Article Views (full-text article views including HTML views, PDF and ePub downloads, according to the available data) and Abstracts Views on Vision4Press platform.
Data correspond to usage on the plateform after 2015. The current usage metrics is available 48-96 hours after online publication and is updated daily on week days.
Initial download of the metrics may take a while.


