Fig. 7
Download original image
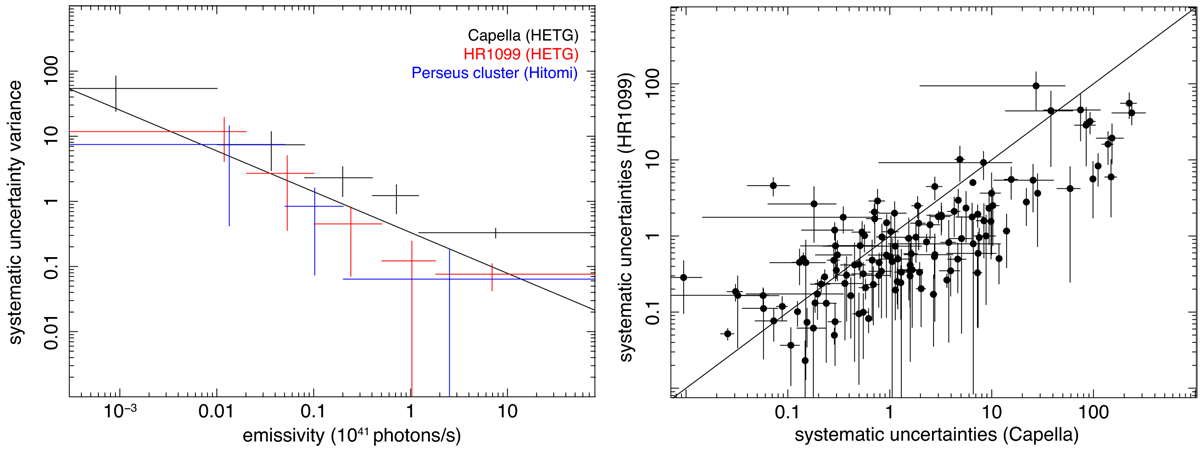
Systematic uncertainties combining the three targets. Left: variances of the systematic uncertainties in the line intensities for Capella (black), HR 1099 (red), and the Perseus cluster (blue). The solid line shows the analytic fit to the combined data (see Table 1). Right: systematic uncertainties obtained with the Capella spectrum plotted against those obtained with the HR 1099 data for the same set of transitions.
Current usage metrics show cumulative count of Article Views (full-text article views including HTML views, PDF and ePub downloads, according to the available data) and Abstracts Views on Vision4Press platform.
Data correspond to usage on the plateform after 2015. The current usage metrics is available 48-96 hours after online publication and is updated daily on week days.
Initial download of the metrics may take a while.