Fig. 3
Download original image
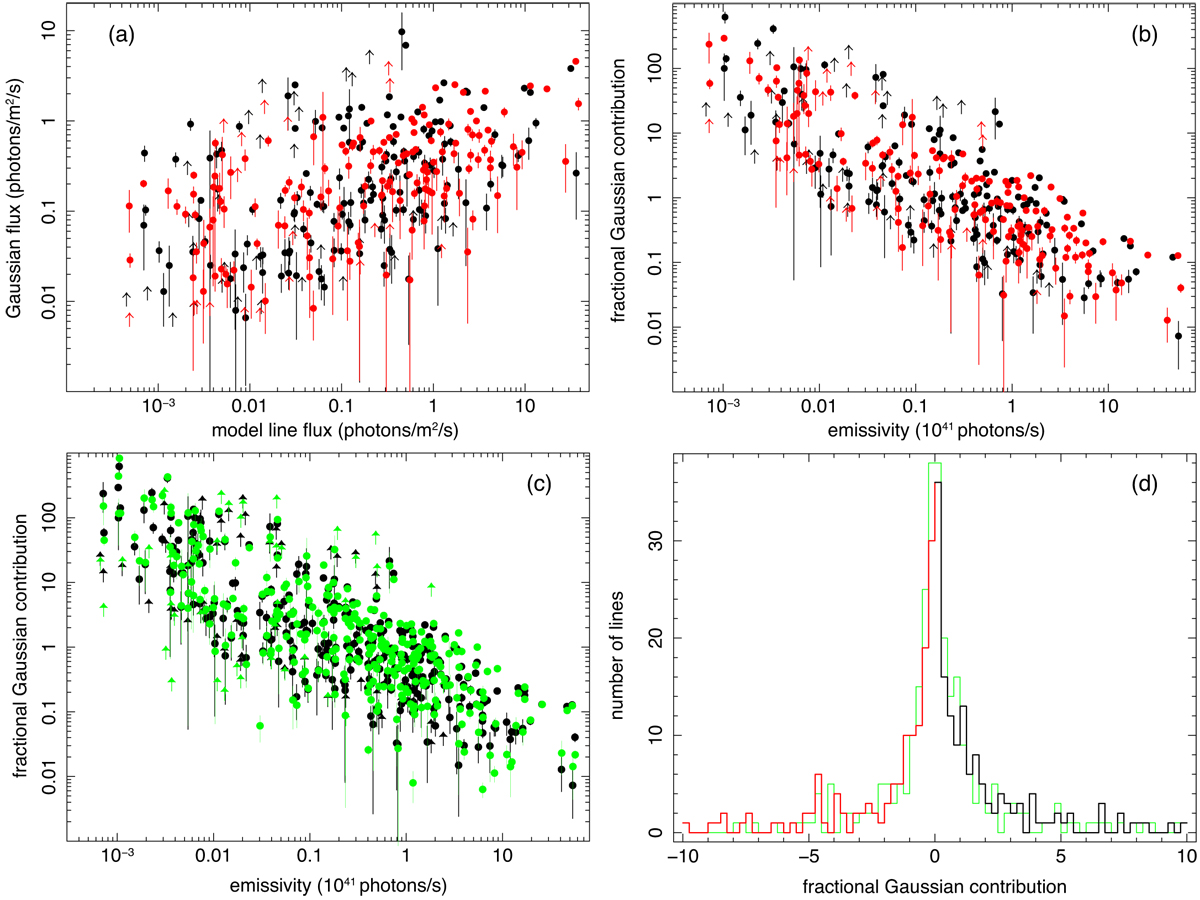
Line flux uncertainties in the modeling of the Capella HETG spectrum. (a) Absolute fluxes of the additional Gaussian components (or the differential fluxes between model 2 and model 1, see Sect. 2.2 for details) plotted against the theoretical fluxes of the corresponding emission lines. Each point represents one line. The black and red data points are the Gaussian components with positive and negative normalizations, respectively. Arrows show the upper limits. (b) Fractional contributions of the Gaussian components to the total fluxes shown as a function of line emissivities. (c) Same as (b), but shows a comparison between the results with line widths fixed (black) and line widths free to fit (green). The black data points include both the black and red data points in (b). (d) Histogram of the Gaussian contribution. The black and red data are the results with positive and negative Gaussian normalizations from the fit with fixed line widths, and the green data are the ones with the free line widths.
Current usage metrics show cumulative count of Article Views (full-text article views including HTML views, PDF and ePub downloads, according to the available data) and Abstracts Views on Vision4Press platform.
Data correspond to usage on the plateform after 2015. The current usage metrics is available 48-96 hours after online publication and is updated daily on week days.
Initial download of the metrics may take a while.