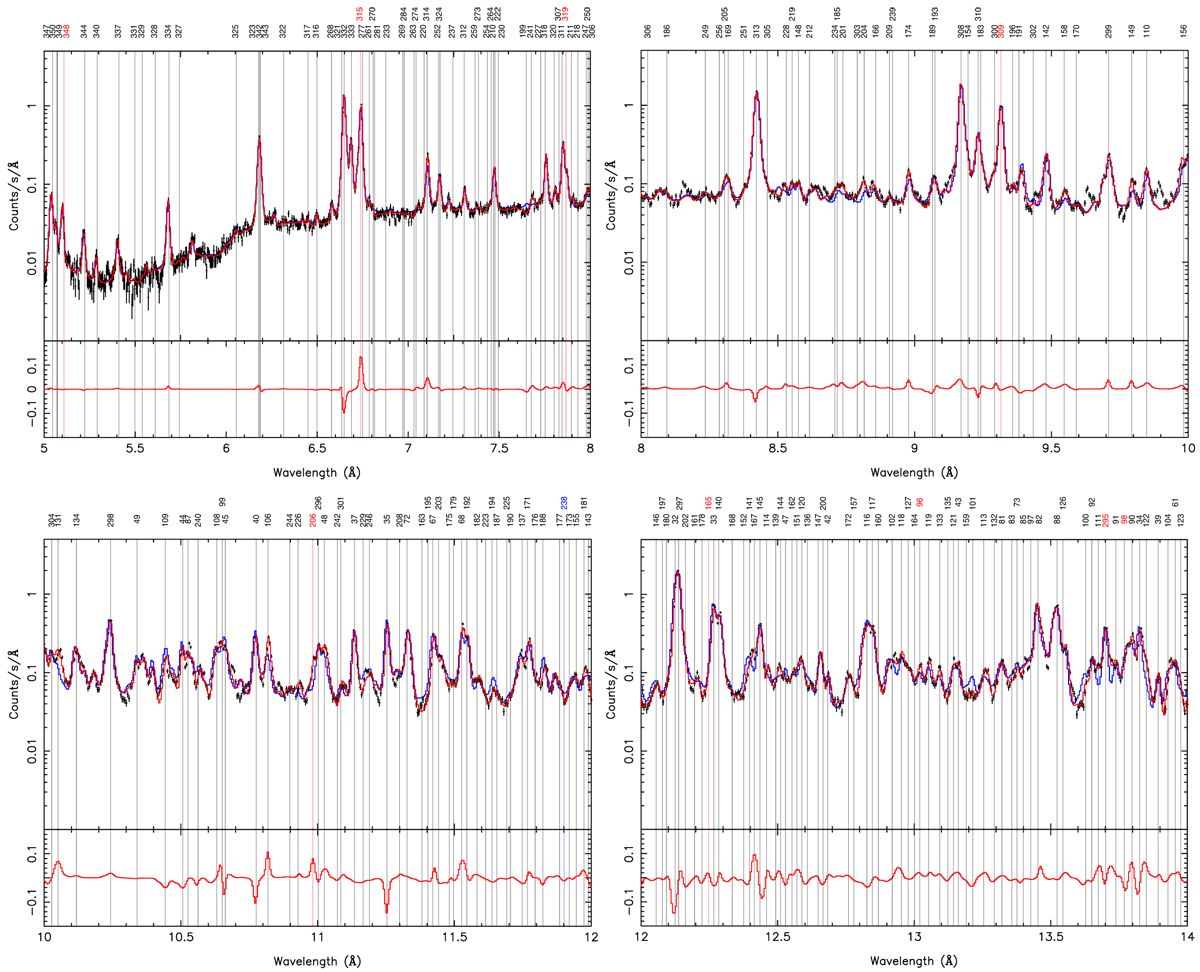
Fig. A.1
Download original image
Stacked Chandra grating spectrum of Capella in 5.0 – 14.0 Å (wavelength region divided by panels) fit with model 1 (ultimate model from paper II, blue) and model 2 (file model plus multiple Gaussian components, red). The relative discrepancies between model 1 and model 2 are shown in the lower panel. The selected lines of interest are marked with thin vertical lines. The numbers on the top are the associated line IDs (see Table A.1 for details), the colors of the numbers indicate the dominant line formation process: black - direct excitation; red - radiative cascade; blue - dielectronic recombination.
Current usage metrics show cumulative count of Article Views (full-text article views including HTML views, PDF and ePub downloads, according to the available data) and Abstracts Views on Vision4Press platform.
Data correspond to usage on the plateform after 2015. The current usage metrics is available 48-96 hours after online publication and is updated daily on week days.
Initial download of the metrics may take a while.