Open Access
Fig. 1.
Download original image
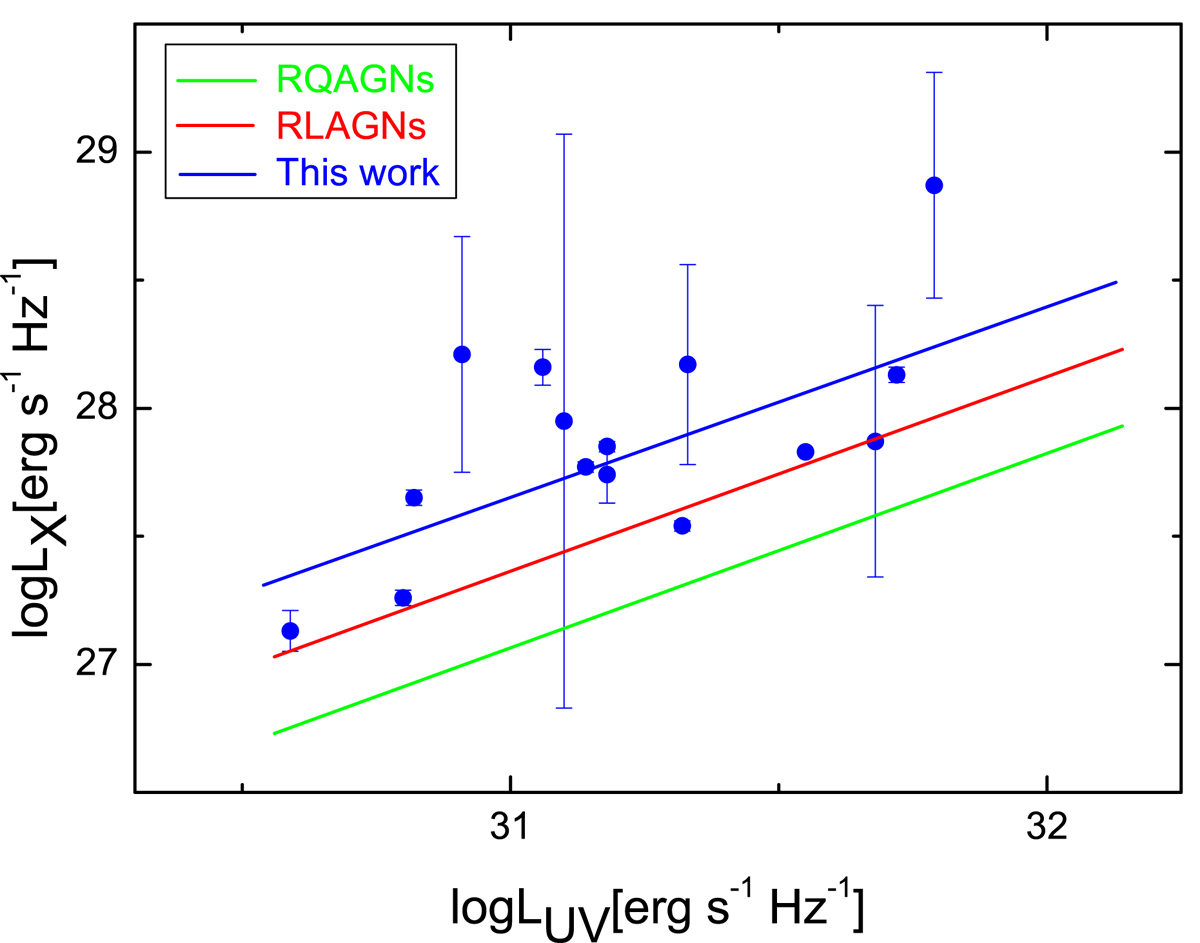
Relationship between the X-ray luminosity LX and optical-UV luminosity LUV in RLAGNs with an EUV deficit, where the blue line represents our best-fitting result. The green line is the best-fitting result for RQAGNs given by Lusso et al. (2010). The red line corresponds to the relationship for RLAGNs without an EUV deficit.
Current usage metrics show cumulative count of Article Views (full-text article views including HTML views, PDF and ePub downloads, according to the available data) and Abstracts Views on Vision4Press platform.
Data correspond to usage on the plateform after 2015. The current usage metrics is available 48-96 hours after online publication and is updated daily on week days.
Initial download of the metrics may take a while.