Fig. 5.
Download original image
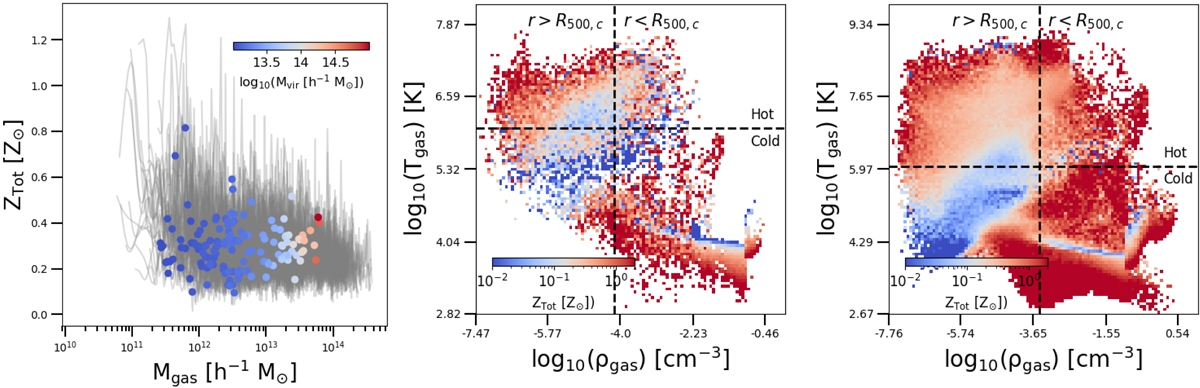
Metallicity as a function of mass and phase diagrams. Left: metallicity as a function of gas mass. The grey lines represent the profiles computed for single objects in our sample, whereas the coloured dots are the values computed at R500, c (again, for each group and cluster present in our sample). The colour-coding is given by the virial mass (Mvir) of the systems. Centre and right: density–temperature phase diagram for the less massive system (centre; Mvir = 1013 h−1 M⊙) and the most massive one in our sample (right; Mvir = 9.8 × 10¹⁴ h−1 M⊙). The colour-coding is given by the mass-weighted metallicity in each density–temperature bin. The dashed horizontal black lines represent the 0.1 keV (1.16 × 10⁶ K) temperature cut, adopted to separate ‘hot’ and ‘cold’ gas phases. The dashed vertical line marks the gas density at R500, c. To the right of this line are the particles inside R500,c, and to the left the particles located at larger radii.
Current usage metrics show cumulative count of Article Views (full-text article views including HTML views, PDF and ePub downloads, according to the available data) and Abstracts Views on Vision4Press platform.
Data correspond to usage on the plateform after 2015. The current usage metrics is available 48-96 hours after online publication and is updated daily on week days.
Initial download of the metrics may take a while.