Fig. 4.
Download original image
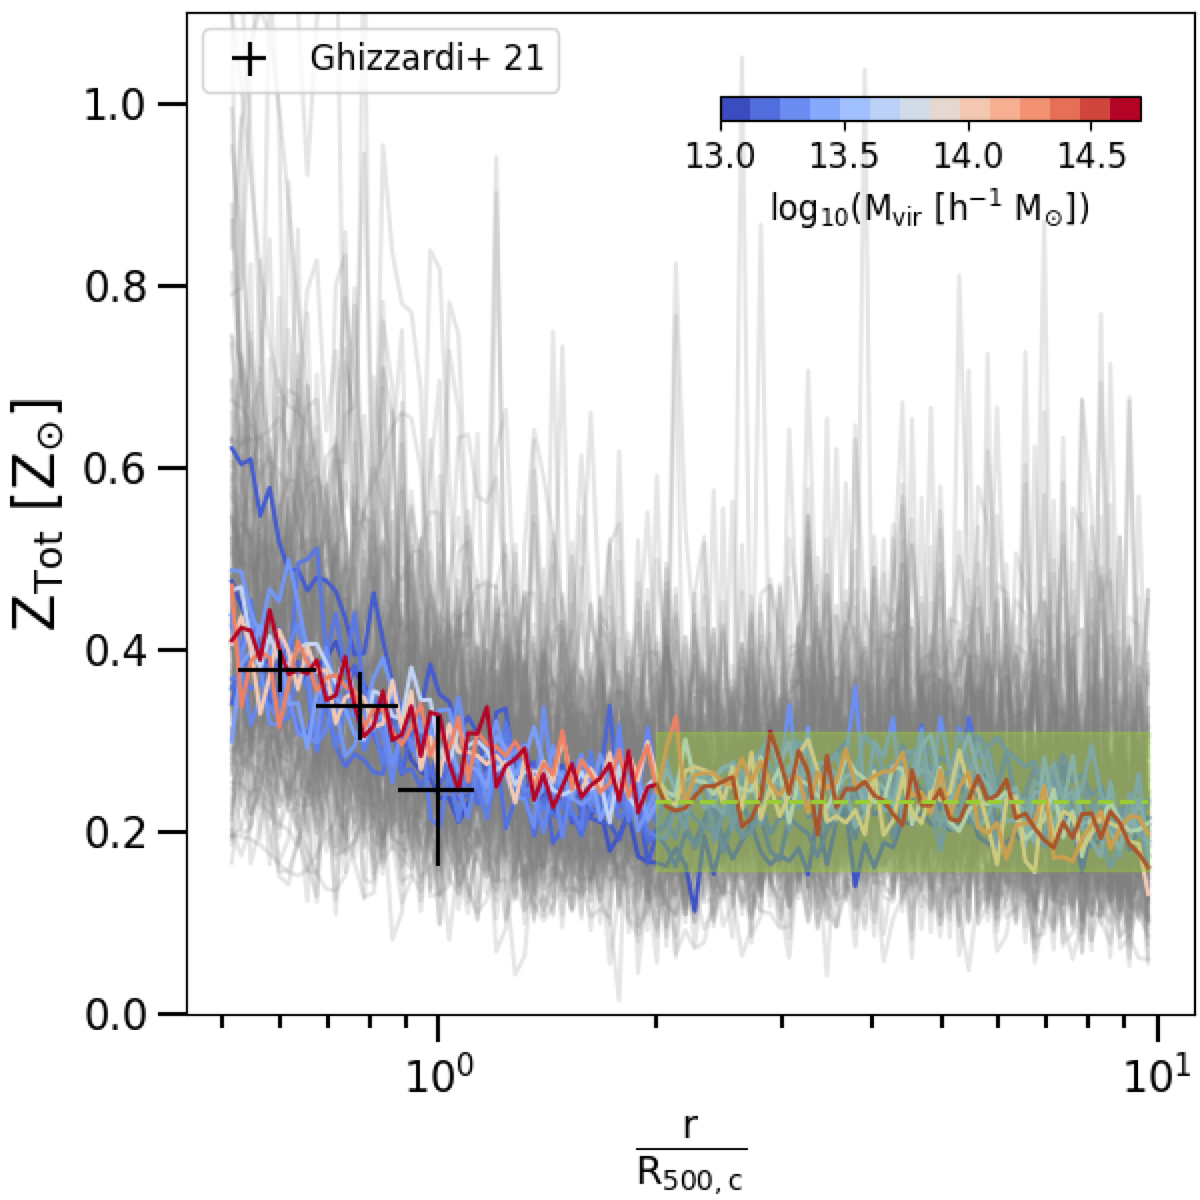
Radial profiles of gas metallicity from 0.5R500, c up to 10R500, c. Grey lines represent single objects, while the coloured ones are the mean values computed in mass bins. The dashed green line and its related shadow region show the median and the 16th and 84th percentiles of the gas metallicity distribution over 2R500, c (![]() ). The black dots are the observed estimates of gas metallicity from Ghizzardi et al. (2021).
). The black dots are the observed estimates of gas metallicity from Ghizzardi et al. (2021).
Current usage metrics show cumulative count of Article Views (full-text article views including HTML views, PDF and ePub downloads, according to the available data) and Abstracts Views on Vision4Press platform.
Data correspond to usage on the plateform after 2015. The current usage metrics is available 48-96 hours after online publication and is updated daily on week days.
Initial download of the metrics may take a while.