Fig. 3.
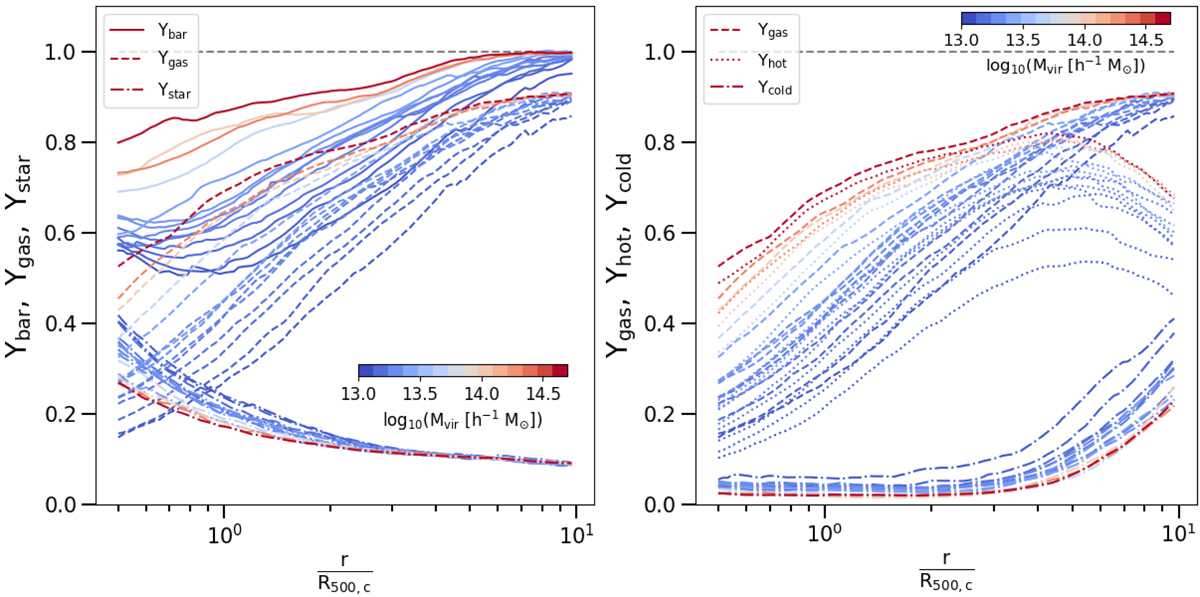
Download original image
Depletion factors in our sample. Left: radial profiles of baryon, gas, and star depletion, from 0.5R500, c up to 10R500, c. The lines represent the median profiles in each mass bin, while the different line styles represent baryon (solid), gas (dashed), or star depletion (dash-dotted). Right: same as the plot on the left, but representing only three different gas particle selections: gas particles (dashed), hot gas with temperatures greater than 0.1 keV (dotted), and cold gas with temperatures below 0.1 keV (dash-dotted).
Current usage metrics show cumulative count of Article Views (full-text article views including HTML views, PDF and ePub downloads, according to the available data) and Abstracts Views on Vision4Press platform.
Data correspond to usage on the plateform after 2015. The current usage metrics is available 48-96 hours after online publication and is updated daily on week days.
Initial download of the metrics may take a while.