Fig. 2.
Download original image
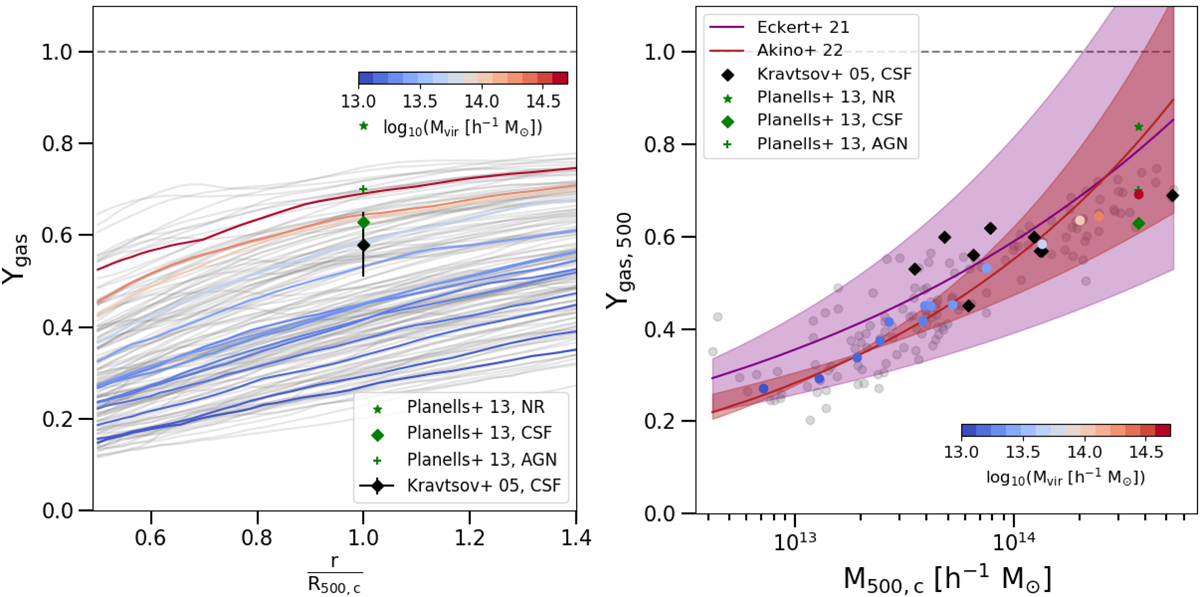
Gas depletion in our sample compared with previous works. Left: radial profiles of gas depletion, from 0.5R500, c up to 1.4R500, c. Grey lines represent single objects in our sample, while the coloured ones are the median values computed in mass bins. Comparison numerical estimates from the literature are given by different symbols (black, Kravtsov et al. 2005; green, Planelles et al. 2013). From Kravtsov et al. (2005), we consider the mean value and its scatter for Ygas at R500, c in the simulations with gas dynamics and several physical processes (CSF). From Planelles et al. (2013), we plot the non-radiative run (NR), the run with star formation and feedback from a supernova explosion (CSF), and a run with the additional contribution from AGN (AGN). Right: gas depletion parameter at R500, c as a function of M500, c. Grey dots represent single objects in our sample, while the coloured ones are the median values computed in mass bins. The constraints from Kravtsov et al. (2005) (black points) are indicated in correspondence with the mass of single clusters in their analysis, whereas for Planelles et al. (2013) (green points) they are indicated in correspondence with our most massive bin. The lines and related shadow regions are the best fits proposed by Eckert et al. (2021) (purple; ![]() ) and Akino et al. (2022) (brick red;
) and Akino et al. (2022) (brick red; ![]() .
.
Current usage metrics show cumulative count of Article Views (full-text article views including HTML views, PDF and ePub downloads, according to the available data) and Abstracts Views on Vision4Press platform.
Data correspond to usage on the plateform after 2015. The current usage metrics is available 48-96 hours after online publication and is updated daily on week days.
Initial download of the metrics may take a while.