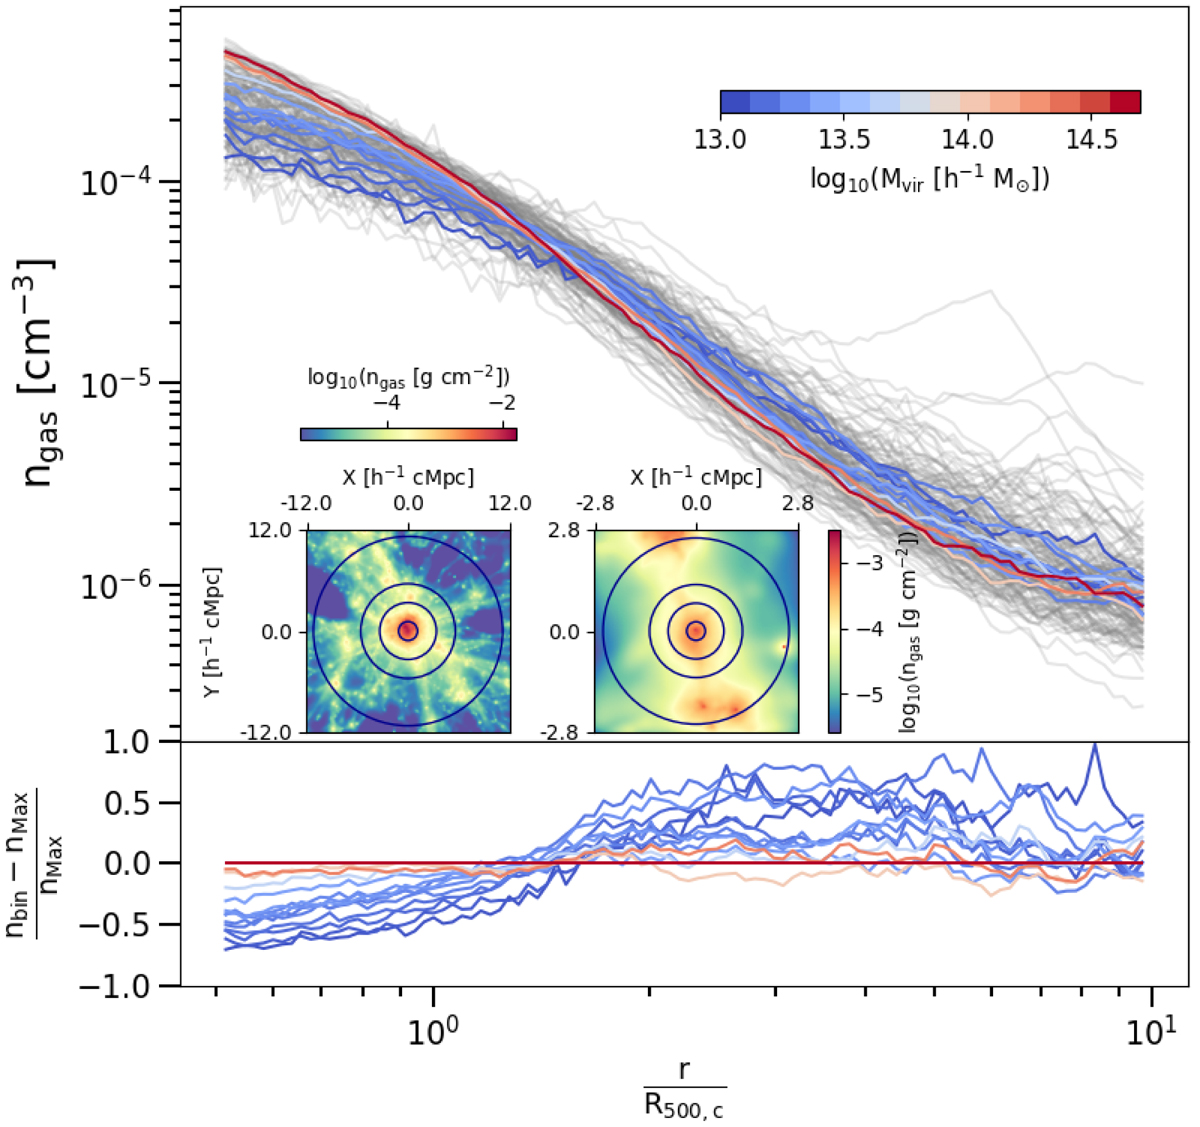
Fig. 1.
Download original image
Gas density profiles and maps. Top: radial profiles of gas density from 0.5R500, c up to 10R500, c. Grey lines indicate profiles of single objects, while coloured lines are the median values computed in different mass bins (see the colour legend). Bottom: median radial profiles of the gas density of different mass bins computed with respect to the median radial profile of the most massive bin (same colour legend as the upper plot). Insets: projected 2D electron gas density maps for the most massive (left; Mvir = 9.8 × 10¹⁴ h−1 M⊙, R500, c = 1120.4 h−1 ckpc) and the least massive (right; Mvir = 1013 h−1 M⊙, R500, c = 252.5 h−1 ckpc) objects in our sample. The blue circles represent 1, 3, 5, and 10R500, c.
Current usage metrics show cumulative count of Article Views (full-text article views including HTML views, PDF and ePub downloads, according to the available data) and Abstracts Views on Vision4Press platform.
Data correspond to usage on the plateform after 2015. The current usage metrics is available 48-96 hours after online publication and is updated daily on week days.
Initial download of the metrics may take a while.