Fig. 9.
Download original image
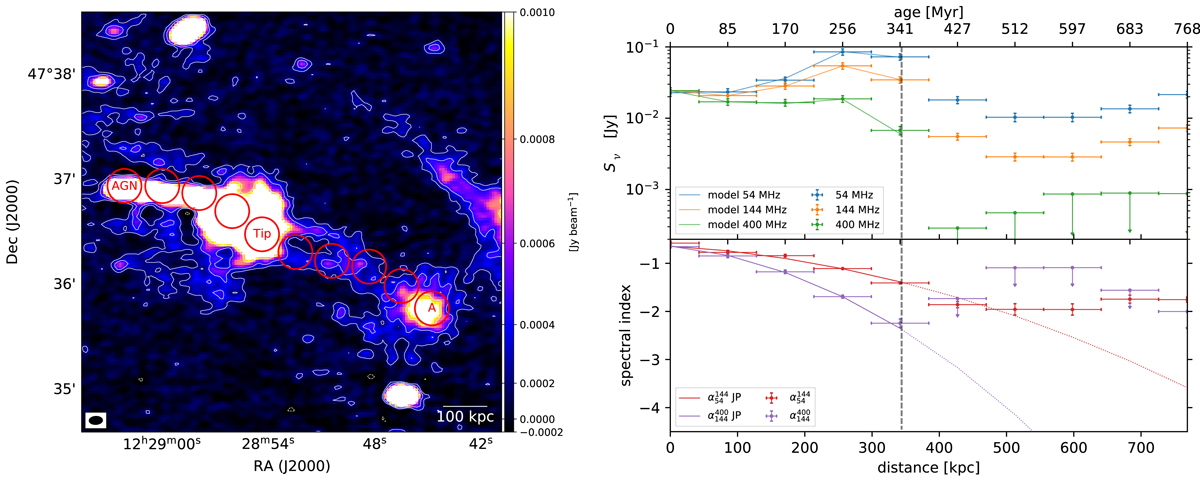
Left: regions from which the spectral index between 54 and 144 MHz was extracted, overlaid on the high-resolution HBA map. Each region is as large as the smallest common circular beam (9.7″ × 9.7″). The AGN, the tip of the AGN tail and source A are labelled. Right: results of the fit of the spectral index. Top panel: flux density at 54 (blue) and 144 (orange) MHz for each region, starting from the AGN position. Bottom panel: spectral index, fitted with a JP ageing model. The curve becomes dashed from the point where the model was extrapolated, indicated by the grey vertical line.
Current usage metrics show cumulative count of Article Views (full-text article views including HTML views, PDF and ePub downloads, according to the available data) and Abstracts Views on Vision4Press platform.
Data correspond to usage on the plateform after 2015. The current usage metrics is available 48-96 hours after online publication and is updated daily on week days.
Initial download of the metrics may take a while.