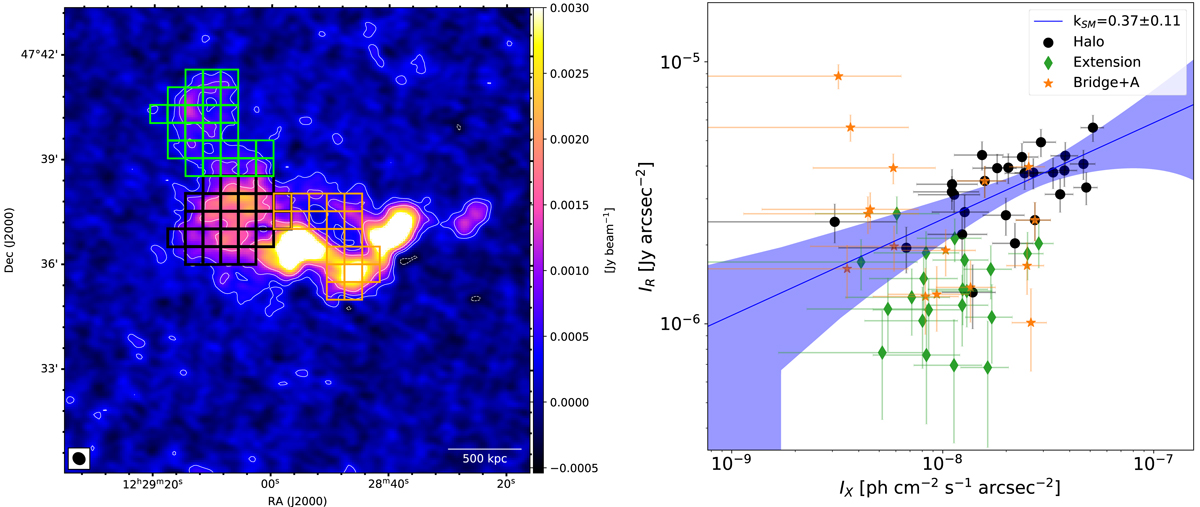
Fig. 7.
Download original image
Results of the ptp analysis. Left: grids used to sample the halo (black), the NE extension (red) and the bridge+source A region (orange). The dimension of the squares is 1.5 times the radio beam, with the beam being 22″ × 19″. Right: point-to-point correlation between radio (144 MHz) and X-ray surface brightness. Black data represents the halo, red represents the NE extension, while orange refers to the SW region including the bridge and source A.
Current usage metrics show cumulative count of Article Views (full-text article views including HTML views, PDF and ePub downloads, according to the available data) and Abstracts Views on Vision4Press platform.
Data correspond to usage on the plateform after 2015. The current usage metrics is available 48-96 hours after online publication and is updated daily on week days.
Initial download of the metrics may take a while.