Fig. 5.
Download original image
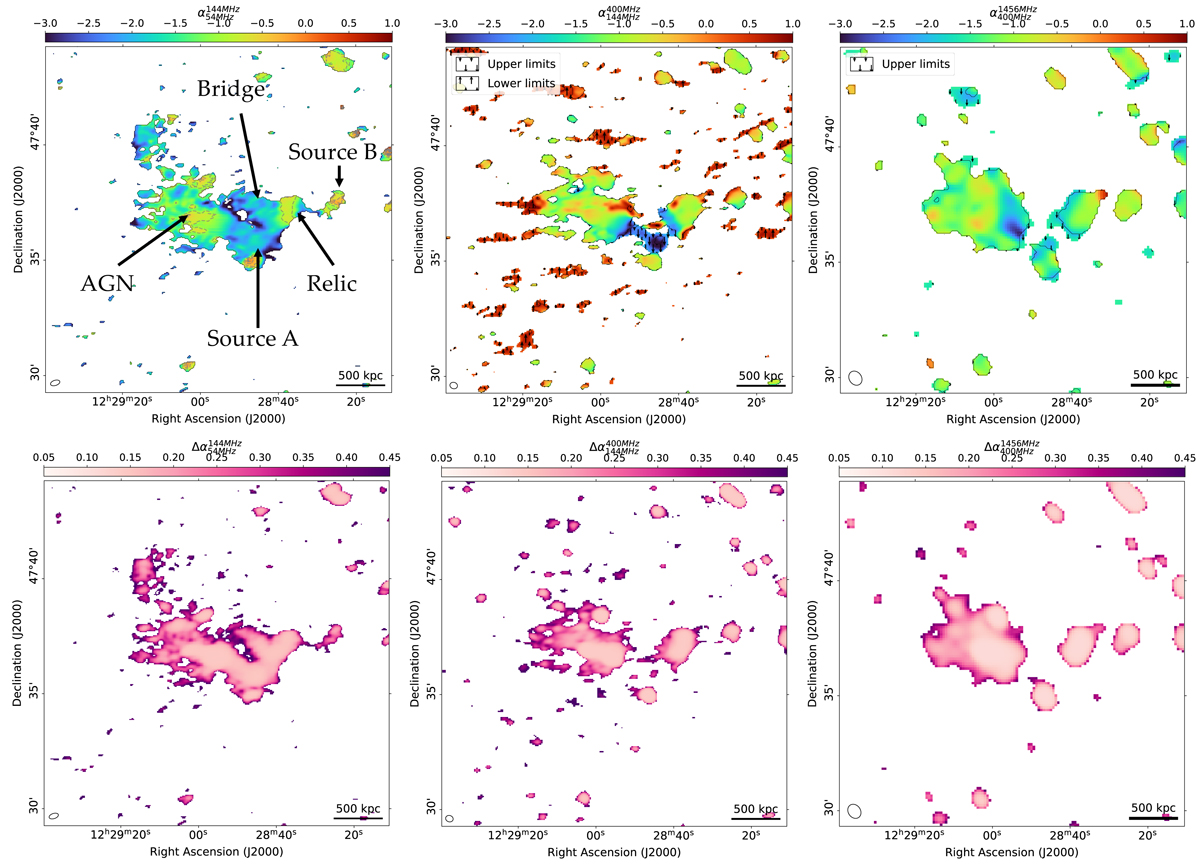
Spectral index and spectral index maps of A1550 between different frequencies. Top left: spectral index map between 54 MHz and 144 MHz, generated by combining total intensity maps produced with matching uv-cut 80λ − 14kλ. Contours are at 3σ from the LBA map. The beam is 25″ ×13″. Top middle: spectral index map between 144 MHz and 400 MHz, generated by combining total intensity maps produced with matching uv-cut 80λ − 14kλ. The beam is 20″ × 17″. Top right: spectral index map between 400 MHz and 1.4 GHz, generated by combining total intensity maps produced with matching uv-cut 140λ − 14kλ. The beam is 38″ × 32″. Bottom left: spectral index error map between 54 MHz and 144 GHz. Bottom middle: spectral index error map between 144 MHz and 300 MHz. Bottom right: spectral index error map between 400 MHz and 1.4 GHz.
Current usage metrics show cumulative count of Article Views (full-text article views including HTML views, PDF and ePub downloads, according to the available data) and Abstracts Views on Vision4Press platform.
Data correspond to usage on the plateform after 2015. The current usage metrics is available 48-96 hours after online publication and is updated daily on week days.
Initial download of the metrics may take a while.