Open Access
Fig. 4.
Download original image
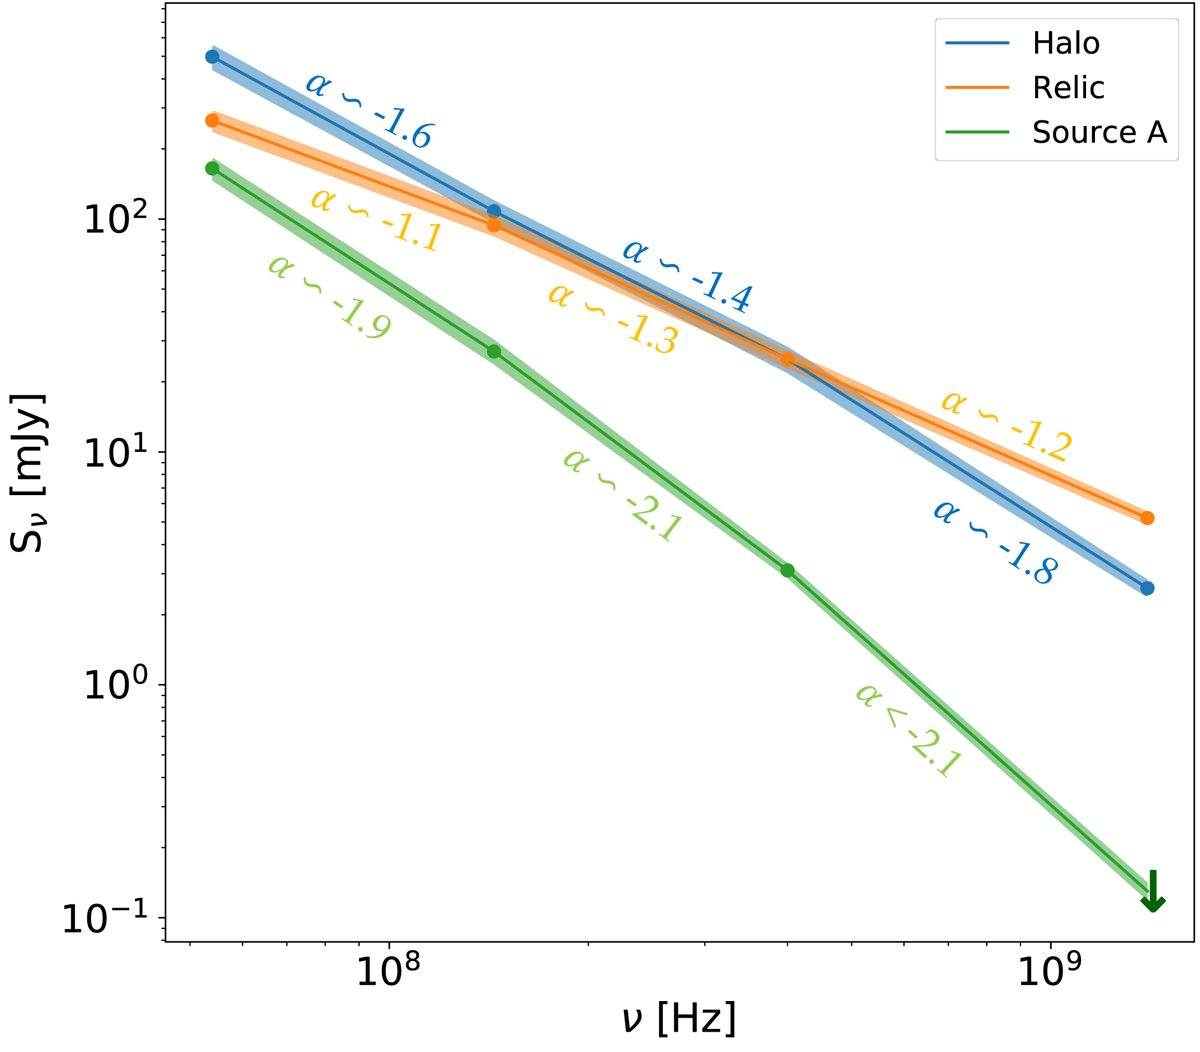
Flux density as a function of frequency for the halo, the relic and source A at the four frequencies covered in our analysis. Coloured areas denote flux density errors. We note that the flux density at 1.4 GHz for source A is a 3σ upper limit, with σ being the rms noise of the 1.4 GHz image.
Current usage metrics show cumulative count of Article Views (full-text article views including HTML views, PDF and ePub downloads, according to the available data) and Abstracts Views on Vision4Press platform.
Data correspond to usage on the plateform after 2015. The current usage metrics is available 48-96 hours after online publication and is updated daily on week days.
Initial download of the metrics may take a while.