Fig. 2.
Download original image
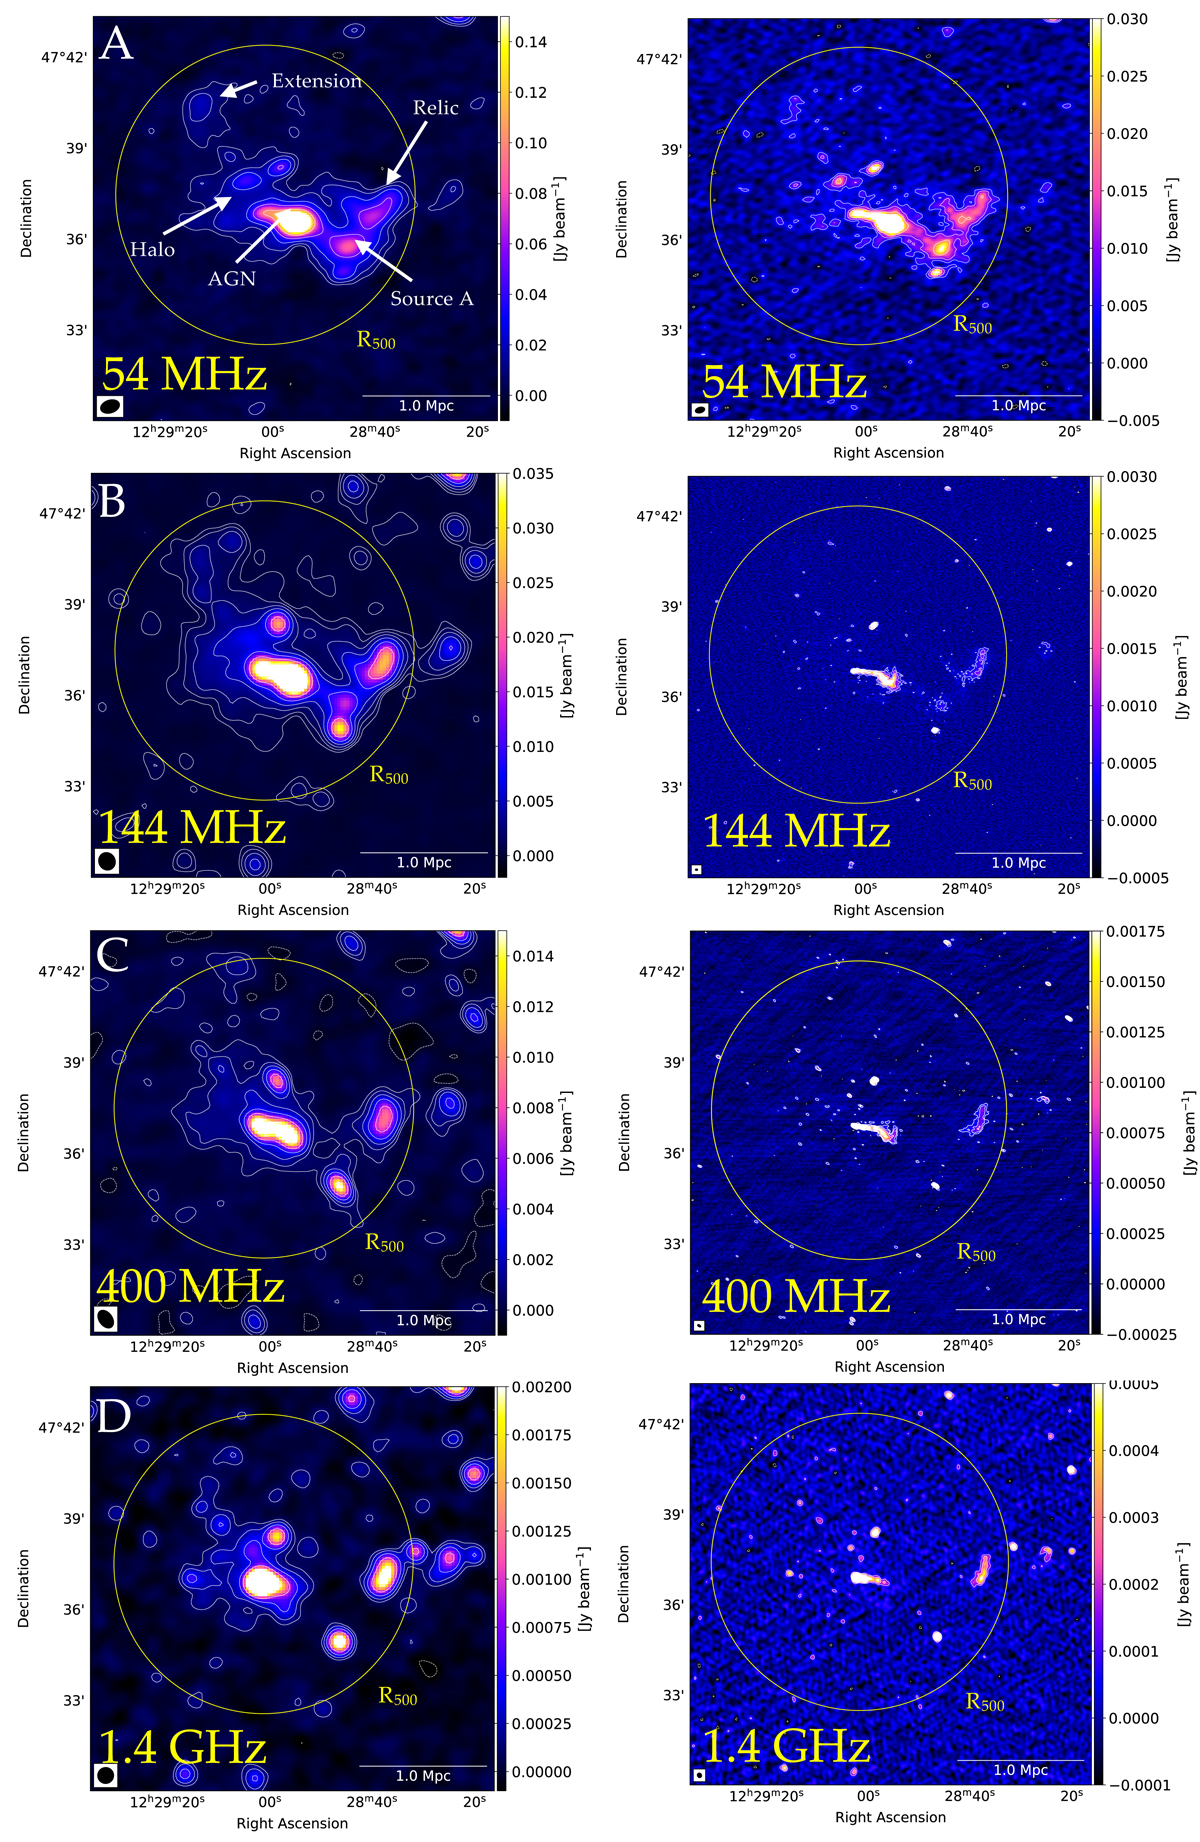
First to last row: 54, 144, 400 MHz and 1.4 GHz, low- (left column) and high-resolution (right column) images of A1550, produced by tapering visibilities at 30″ and applying Briggs −0.6, respectively. The yellow circle denotes R500 = 1173 kpc (Botteon et al. 2022). Row A, left panel: 54 MHz low-resolution image. The beam is 38″ × 25″, with rms noise σ ∼ 1.6 mJy beam−1. Contours are at [−3, 3, 6, 12, 24]×σ. Row A, right panel: 54 MHz high-resolution image. The beam is 18″ × 11″, with rms noise σ ∼ 1.5 mJy beam−1. Row B, left panel: 144 MHz low-resolution image. The beam is 35″ × 32″, with rms noise σ ∼ 0.14 mJy beam−1. Row B, right panel: 144 MHz high-resolution image. The beam is 8″ × 4″, with rms noise σ ∼ 69 μJy beam−1. Row C, left panel: 400 MHz low-resolution image. The beam is 38″ ×26″, with rms noise σ ∼ 0.28 mJy beam−1. Row C, right panel: 400 MHz high-resolution image. The beam is 6″ × 3″, with rms noise σ ∼ 60 μJy beam−1. Row D, left panel: 1.4 GHz low-resolution image. The beam is 32″×32″, with rms noise σ ∼ 26 μJy beam−1. Row D, right panel: 1.4 GHz high-resolution image. The beam is 13″ × 12″, with rms noise σ ∼ 18 μJy beam−1.
Current usage metrics show cumulative count of Article Views (full-text article views including HTML views, PDF and ePub downloads, according to the available data) and Abstracts Views on Vision4Press platform.
Data correspond to usage on the plateform after 2015. The current usage metrics is available 48-96 hours after online publication and is updated daily on week days.
Initial download of the metrics may take a while.