Open Access
Fig. A.1.
Download original image
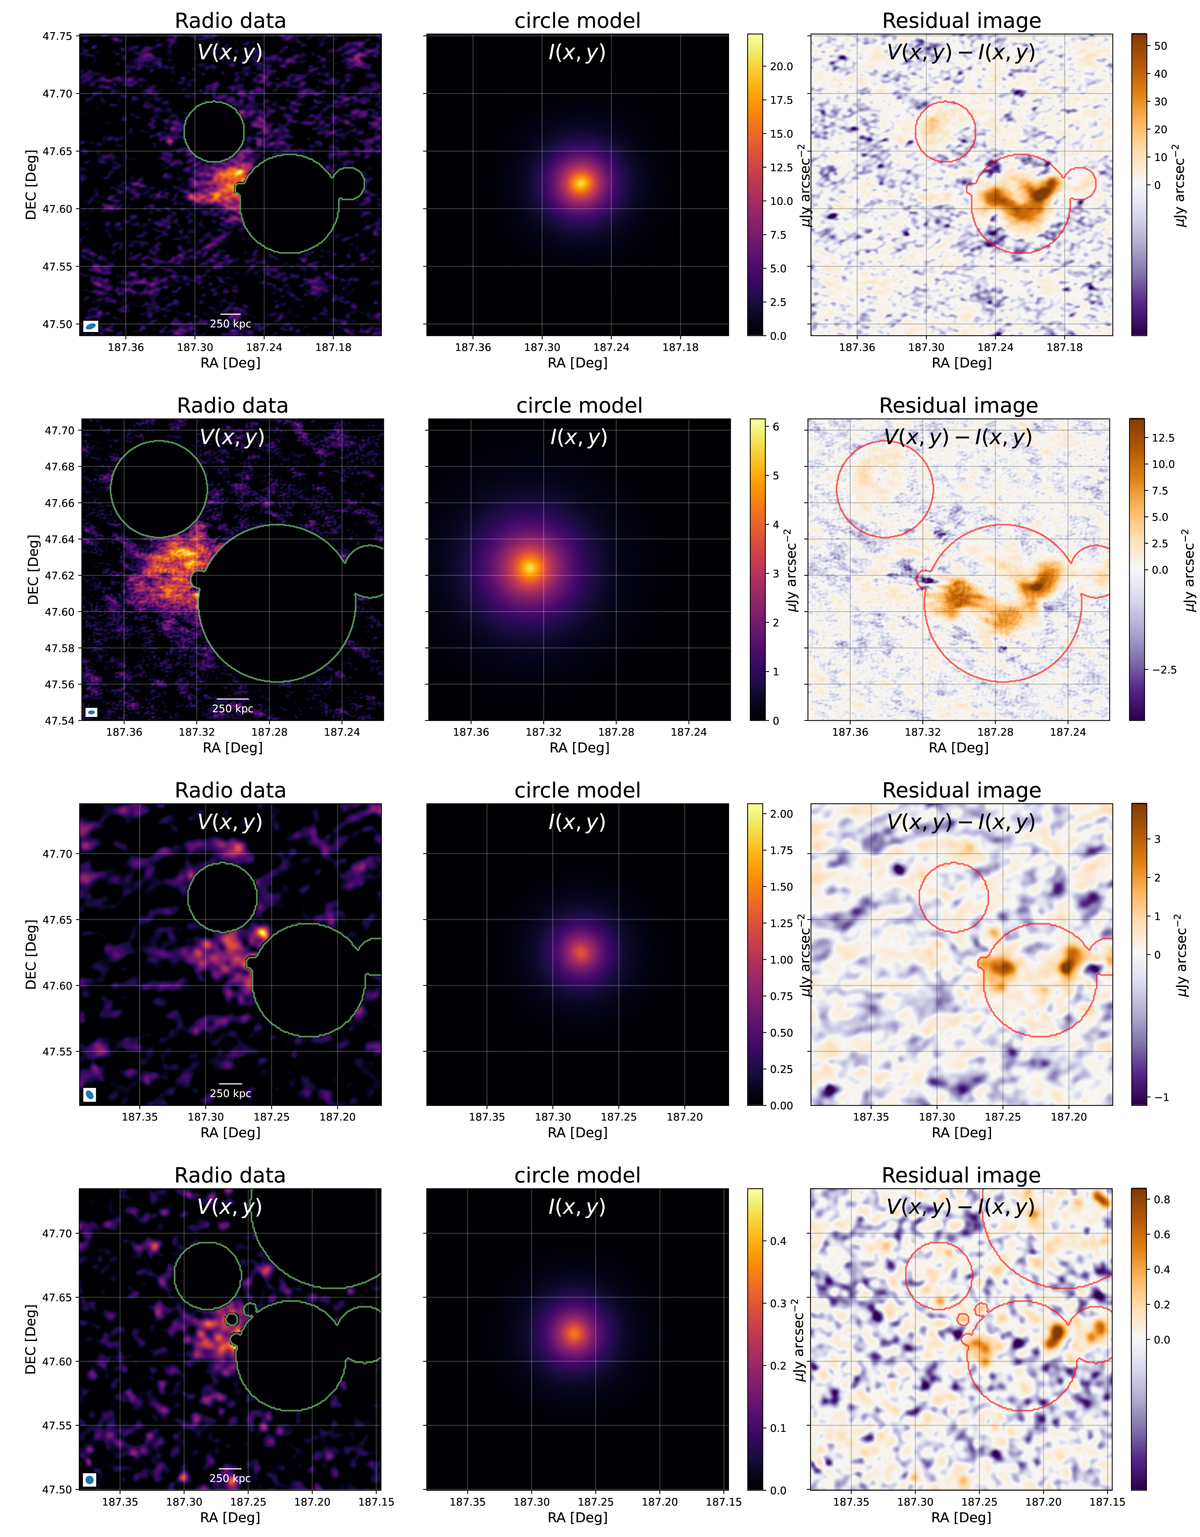
From top to bottom, from left to right: 54, 144, 400 and 1400 MHz modelling of the radio halo, halo centre as detected from a circle model, and residual images with masks applied to exclude sources from the flux density calculation.
Current usage metrics show cumulative count of Article Views (full-text article views including HTML views, PDF and ePub downloads, according to the available data) and Abstracts Views on Vision4Press platform.
Data correspond to usage on the plateform after 2015. The current usage metrics is available 48-96 hours after online publication and is updated daily on week days.
Initial download of the metrics may take a while.