Fig. 1.
Download original image
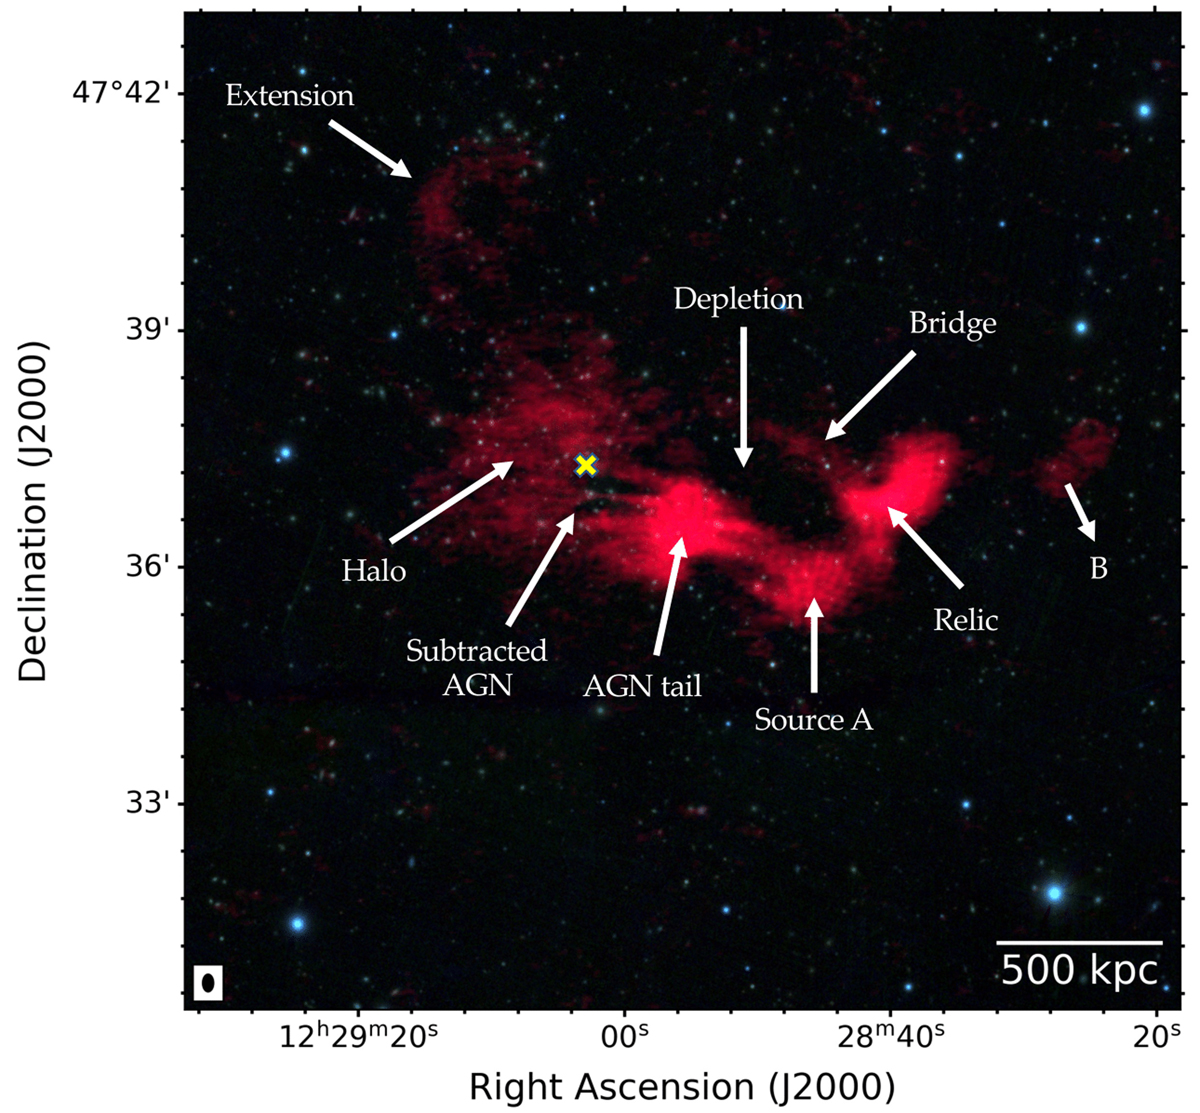
A1550 seen in 144 MHz emission (red) as detected by LOFAR overlaid on the PanSTARSS optical (RGB filters) image. The radio image has a resolution of 13″ × 8″, and the beam is shown on the bottom right. The most prominent structures that are discussed in the text are labelled. Compact sources are subtracted to enhance diffuse emission as described in Sect. 2.1. The yellow cross marks the cluster X-ray centre, defined as the peak of the emission and estimated from the Chandra image presented in Sect. 2.5.
Current usage metrics show cumulative count of Article Views (full-text article views including HTML views, PDF and ePub downloads, according to the available data) and Abstracts Views on Vision4Press platform.
Data correspond to usage on the plateform after 2015. The current usage metrics is available 48-96 hours after online publication and is updated daily on week days.
Initial download of the metrics may take a while.