Fig. 5
Download original image
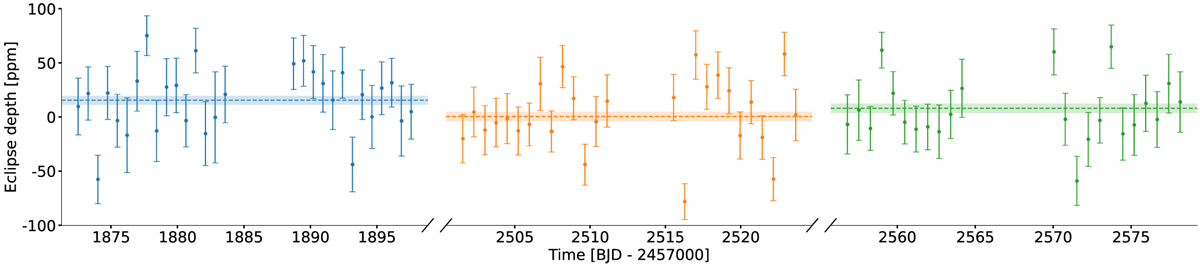
Individual occultation of depth versus time. Partial occultations were discarded. Blue circles correspond to the best-fit median value in sector 21, orange circles belong to measurements in sector 44, and green circles correspond to sector 46. The error bars represent 1σ uncertainty. Horizontal dashed lines and the shaded area are the best-fit median value and 1σ uncertainty obtained by fitting over the entire sector (see Table 1).
Current usage metrics show cumulative count of Article Views (full-text article views including HTML views, PDF and ePub downloads, according to the available data) and Abstracts Views on Vision4Press platform.
Data correspond to usage on the plateform after 2015. The current usage metrics is available 48-96 hours after online publication and is updated daily on week days.
Initial download of the metrics may take a while.