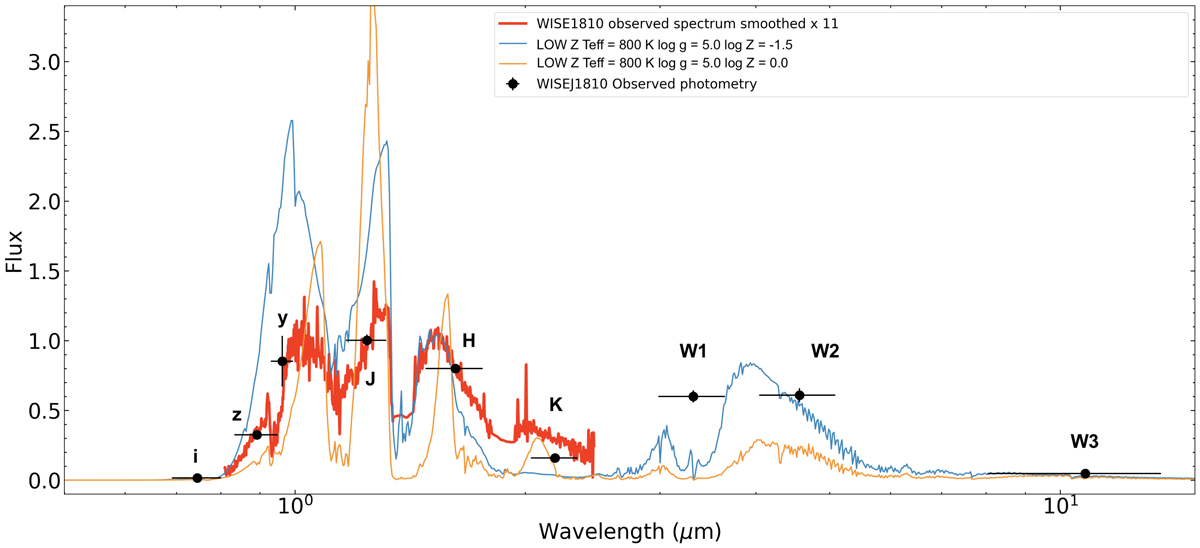
Fig. 10.
Download original image
Comparison of the observed photometry (black dots) and spectrum (red line) of WISE1810 to LOWZ models (Meisner et al. 2021). Solar (blue) and low-metallicity [Fe/H] = −1.5 (orange) models are computed for Teff = 800 K, log g = 5.0 dex and a solar C/O ratio. The blue wing of the H band and the W2 photometry are reasonably replicated by the metal-depleted theoretical spectrum. All data are normalised between 1.5 and 1.6 μm. The wavelength axis is in the logarithmic scale.
Current usage metrics show cumulative count of Article Views (full-text article views including HTML views, PDF and ePub downloads, according to the available data) and Abstracts Views on Vision4Press platform.
Data correspond to usage on the plateform after 2015. The current usage metrics is available 48-96 hours after online publication and is updated daily on week days.
Initial download of the metrics may take a while.