Fig. 5
Download original image
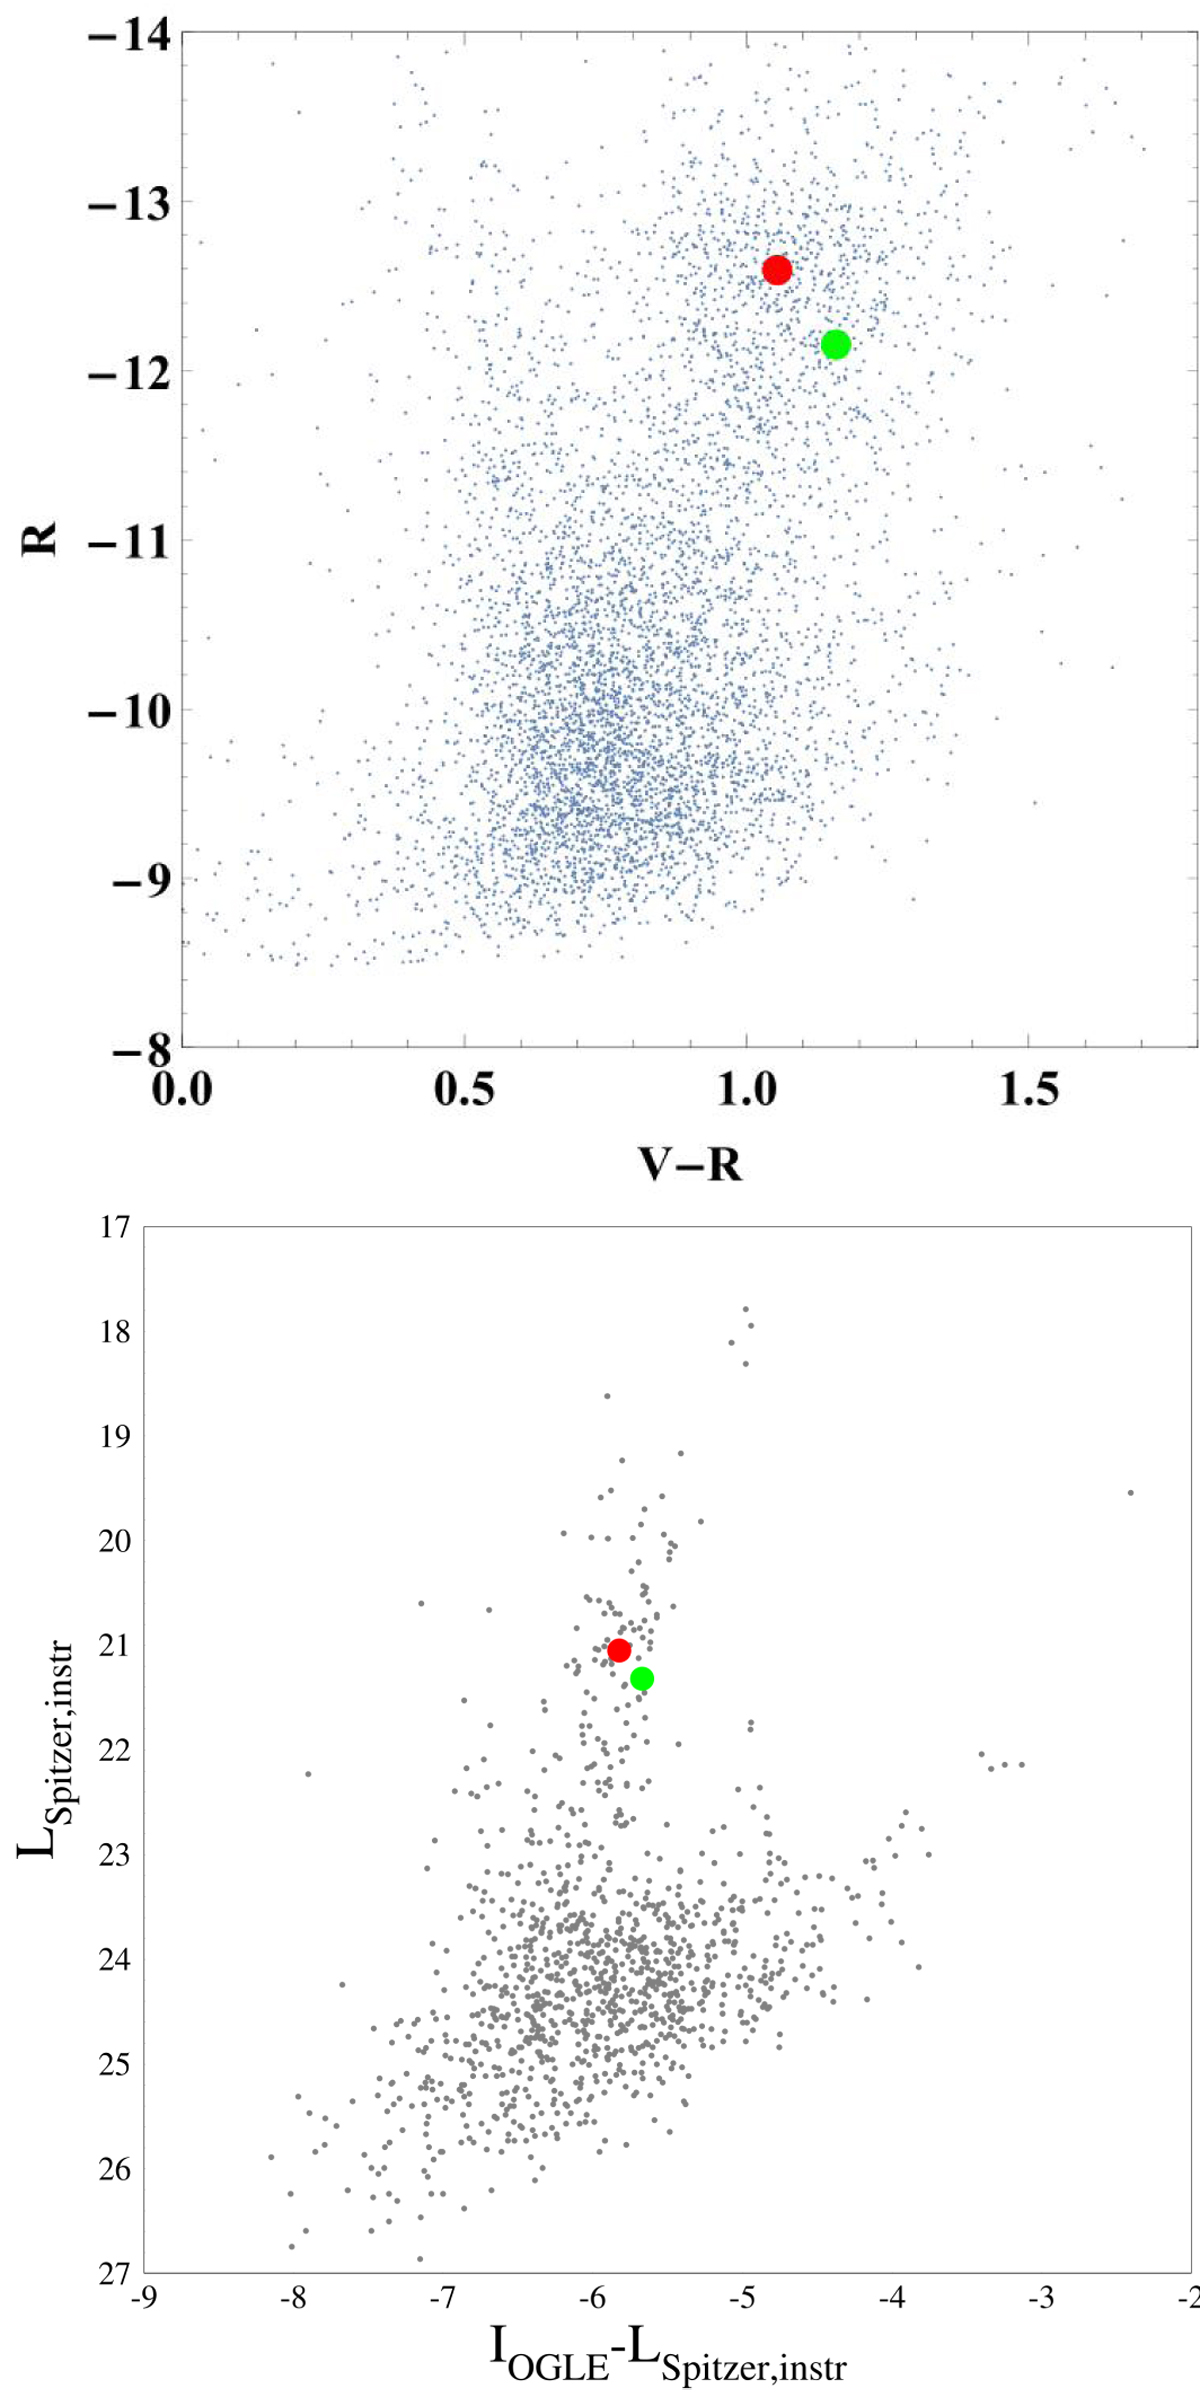
Color-magnitude diagrams using different resources. Top panel: CMD of stars in the 2′ field of the event OGLE-2019-BLG-0033 built from MOA observations. The red dot corresponds to the center of the red clump and the green dot shows the position of the source. Bottom panel: CMD built from I-band observations from OGLE and L-band measurements from Spitzer.
Current usage metrics show cumulative count of Article Views (full-text article views including HTML views, PDF and ePub downloads, according to the available data) and Abstracts Views on Vision4Press platform.
Data correspond to usage on the plateform after 2015. The current usage metrics is available 48-96 hours after online publication and is updated daily on week days.
Initial download of the metrics may take a while.