Fig. 6.
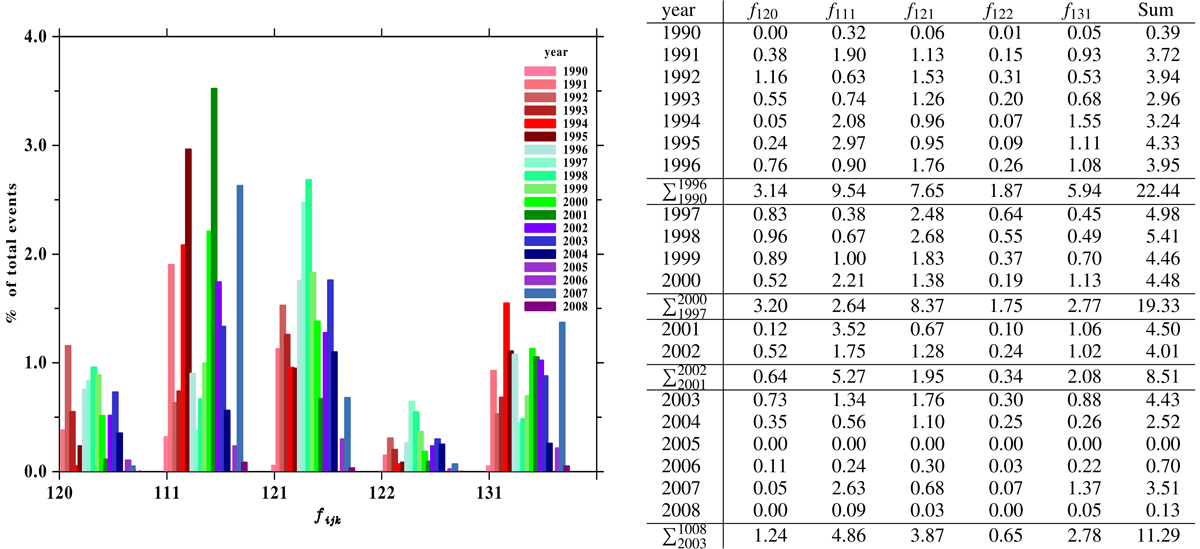
Download original image
Histogram and table of relative numbers given on a yearly basis. Left panel: histogram for the BFs of individual years. Inside a distribution function fijk each bar represents the events per year, from 1990 to 2008. The data for 2005 are missing. The data for 1990 at the beginning of the mission are very sparse, which is also the case towards the end of the mission (after 2005). Right panel: relative number of events by the BFs of the five most representative distribution functions. For each intermediate row, ![]() gives the sum of the years above, and the last column (‘Sum’) gives the sums of each row. The sum of the last column is 61.57%. Thus, with these five distribution functions we cover approximately 62% of all events (70.7% events without CME).
gives the sum of the years above, and the last column (‘Sum’) gives the sums of each row. The sum of the last column is 61.57%. Thus, with these five distribution functions we cover approximately 62% of all events (70.7% events without CME).
Current usage metrics show cumulative count of Article Views (full-text article views including HTML views, PDF and ePub downloads, according to the available data) and Abstracts Views on Vision4Press platform.
Data correspond to usage on the plateform after 2015. The current usage metrics is available 48-96 hours after online publication and is updated daily on week days.
Initial download of the metrics may take a while.