Fig. 8.
Download original image
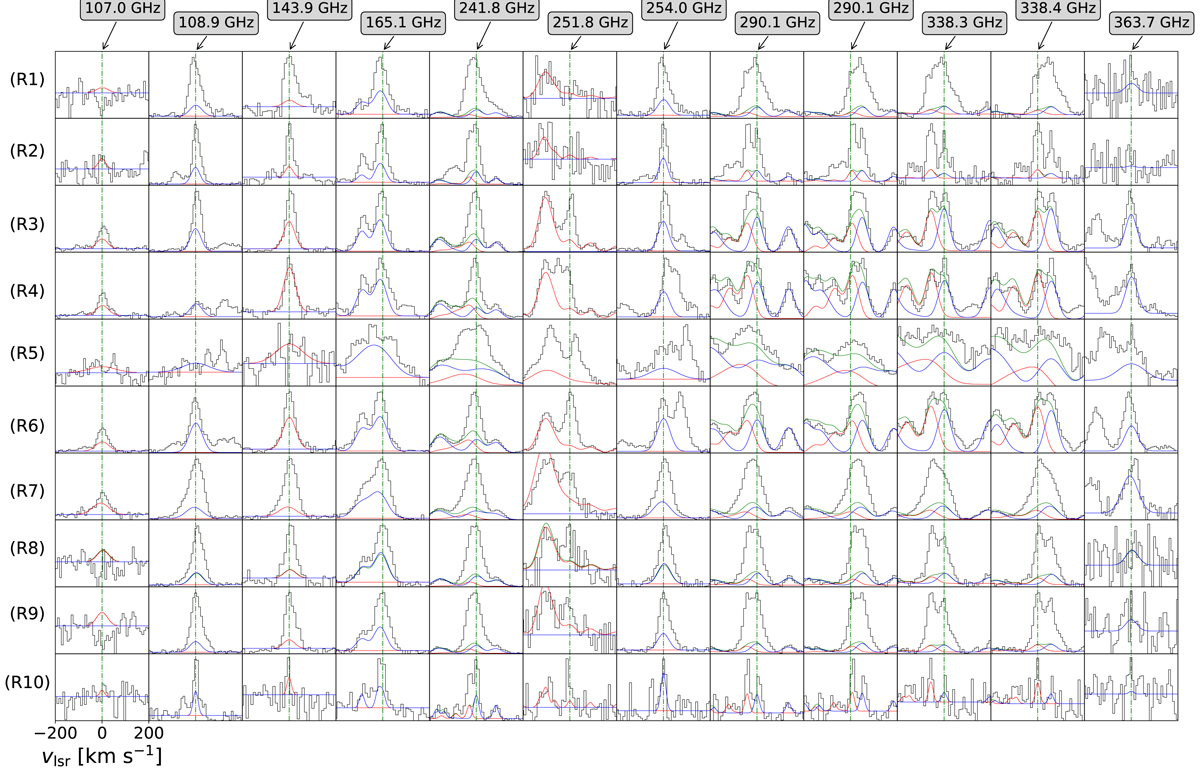
Outliers to our LTE modeling (see Appendix D) with positive optical depths. The only exceptions are the J1 → J0A−+ line series, recently proposed to present methanol maser Class II activity by Zinchenko et al. (2017). Line frequencies are labeled at the top of the Figure. Most of the lines are unclassified so far. Labels and colors are the same as for Fig. 7.
Current usage metrics show cumulative count of Article Views (full-text article views including HTML views, PDF and ePub downloads, according to the available data) and Abstracts Views on Vision4Press platform.
Data correspond to usage on the plateform after 2015. The current usage metrics is available 48-96 hours after online publication and is updated daily on week days.
Initial download of the metrics may take a while.