Fig. 7.
Download original image
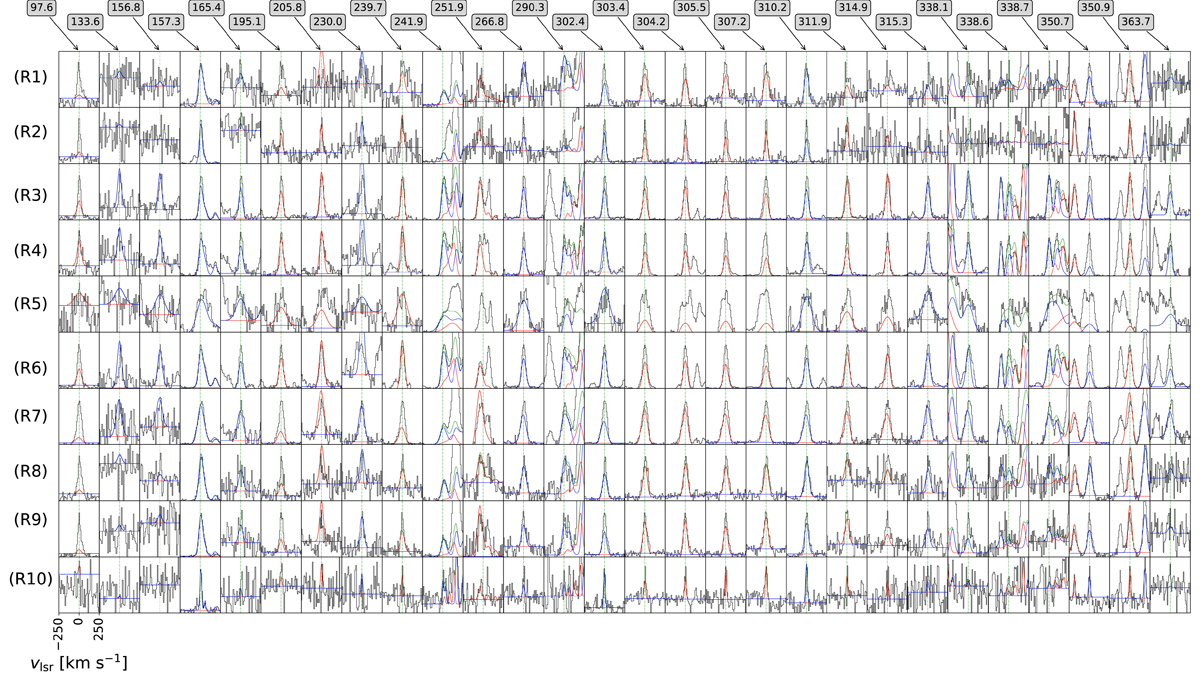
Zoom into successfully fitted lines for each region, which can be considered to follow LTE conditions. Red and blue colors indicate methanol A- and E-type, respectively, while the superposition of the two types, the final fit, is indicated in green. Line frequencies (in GHz units) are labeled at the top of the figure and are also indicated as a green dashed vertical line inside panels, while the velocity range (in km s−1 with respect to the systemic velocity of the individual regions, see Fig. 4) is indicated in the bottom-left corner. Regions 1–10 are ordered from top to bottom as indicated in the leftmost panel (R from “Region” plus the corresponding number).
Current usage metrics show cumulative count of Article Views (full-text article views including HTML views, PDF and ePub downloads, according to the available data) and Abstracts Views on Vision4Press platform.
Data correspond to usage on the plateform after 2015. The current usage metrics is available 48-96 hours after online publication and is updated daily on week days.
Initial download of the metrics may take a while.