Fig. 6.
Download original image
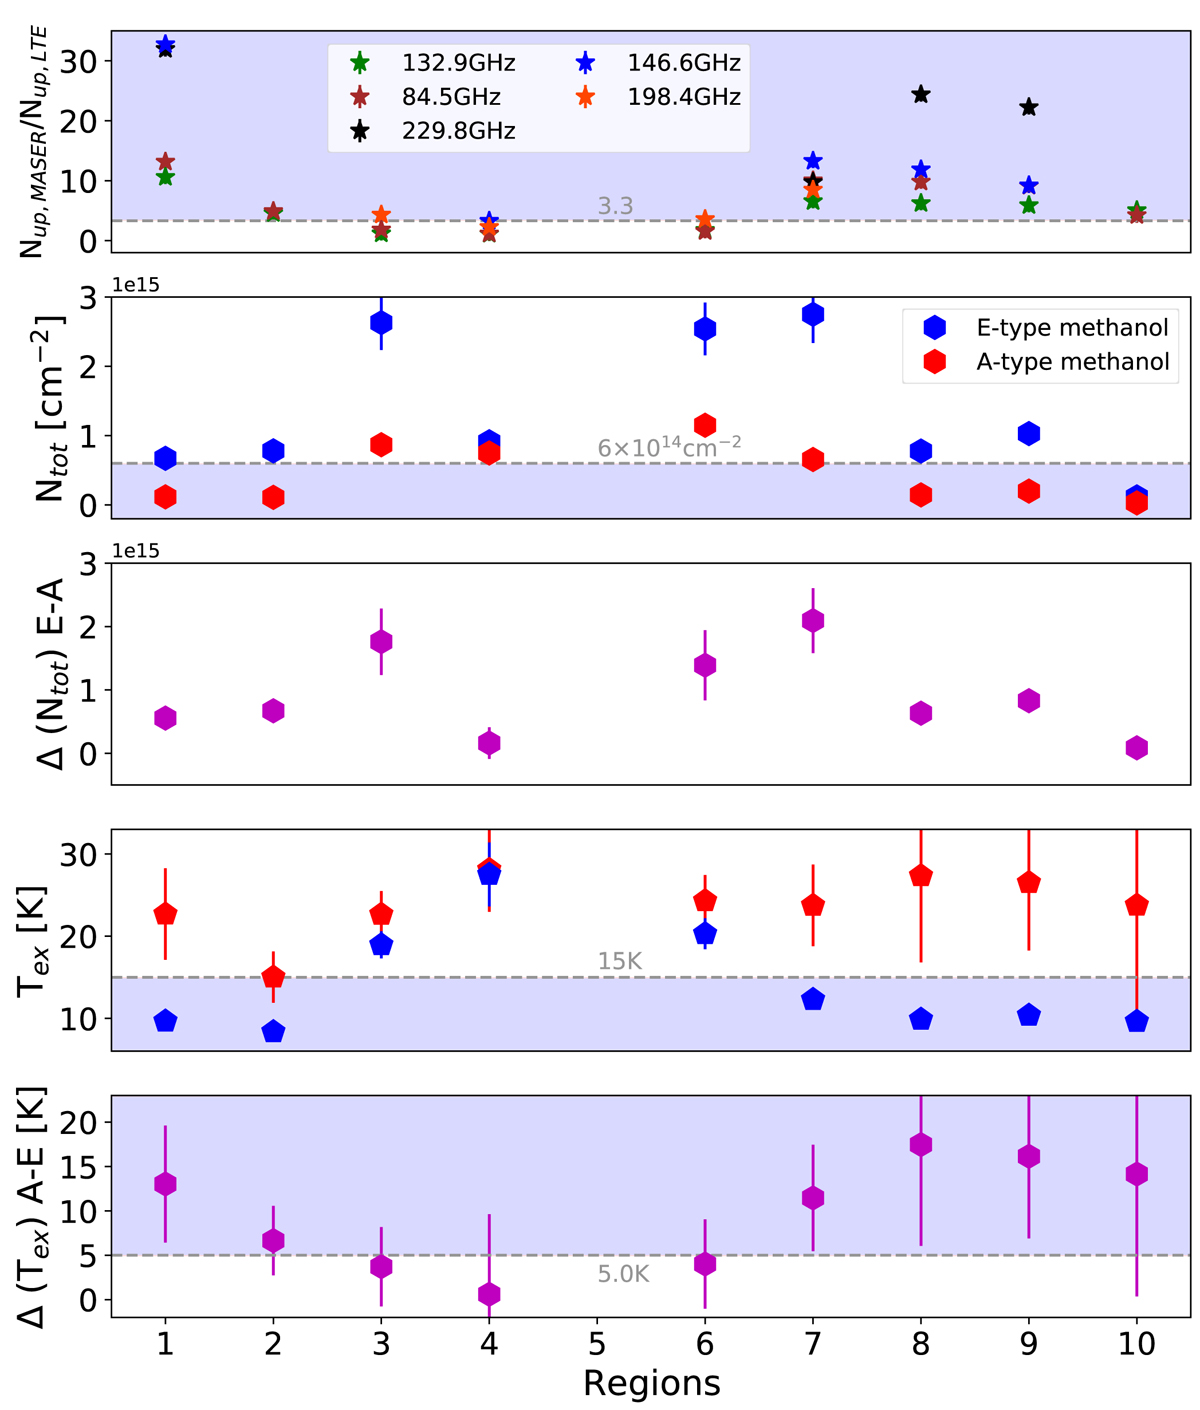
Physical conditions for the methanol maser candidates (see Table 2) derived from our rotation diagrams. The x-axis indicates the number of the region. The y-axis represents, from top to bottom, (1) the ratio between the nominal upper level column densities of the lines Nup, MASER and the expected values from our best fit to LTE conditions Nup,LTE, (2) the total column density, (3) the difference between total E– and A–type column densities, (4) the LTE excitation temperatures and (5) the difference between the A– and E–type excitation temperatures. Shaded areas highlight regions were maser emission in the J−1 → (J − 1)0 − E line series (at 84, 132, and 229 GHz), and the J0 → (J − 1)1 − A+ line series (at 146 and 198.4 GHz), are observed, according to the first panel.
Current usage metrics show cumulative count of Article Views (full-text article views including HTML views, PDF and ePub downloads, according to the available data) and Abstracts Views on Vision4Press platform.
Data correspond to usage on the plateform after 2015. The current usage metrics is available 48-96 hours after online publication and is updated daily on week days.
Initial download of the metrics may take a while.