Fig. 4.
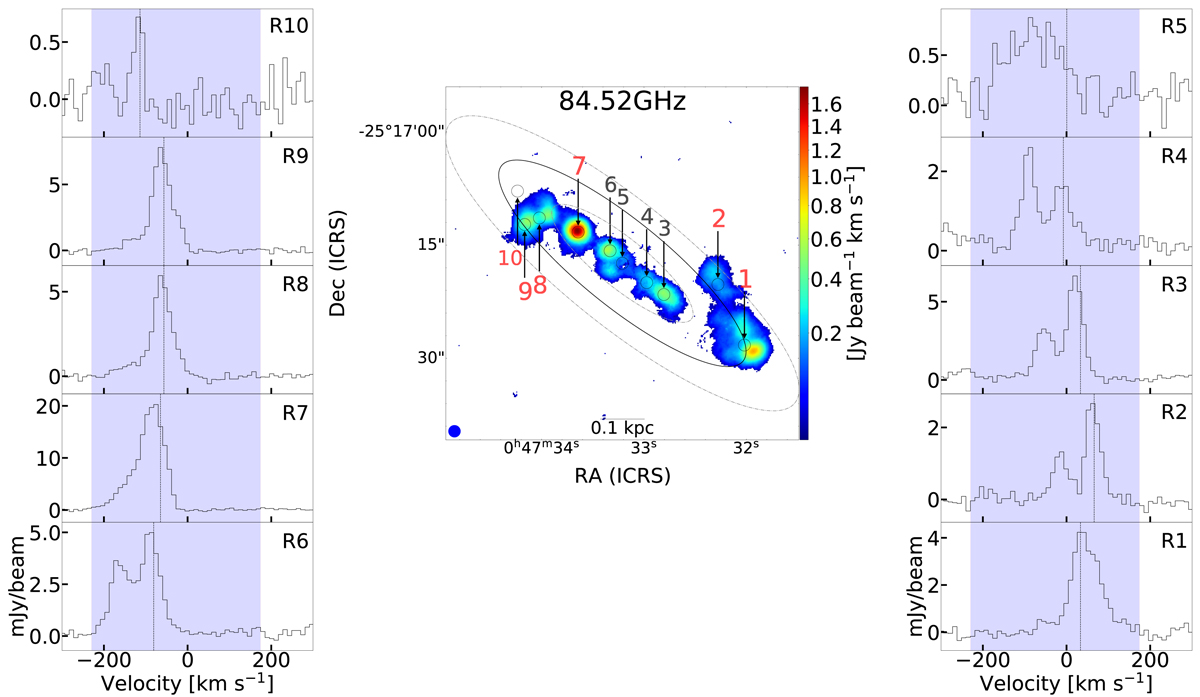
Download original image
Central panel: velocity integrated intensity of the 5−1 → 40 − E methanol line at 84.5 GHz obtained by integrating the channels inside the colored areas shown in the side panels. Regions where we detect Class I maser emission in the J−1 → (J − 1)0 − E series (see Sect. 4.1.2) are labeled in red and with slightly larger numbers. Side panels: methanol spectra of the different regions as labeled in the top right corner of each panel (a vsys of 258.8 km s−1 was subtracted). Vertical lines indicate the peak velocity of the 13CO J = 1 − 0 line (110.2 GHz) extracted in each region, as a reference for the systemic velocity at that position. Coordinate system, beam size and other parameters are the same as in Fig. 1.
Current usage metrics show cumulative count of Article Views (full-text article views including HTML views, PDF and ePub downloads, according to the available data) and Abstracts Views on Vision4Press platform.
Data correspond to usage on the plateform after 2015. The current usage metrics is available 48-96 hours after online publication and is updated daily on week days.
Initial download of the metrics may take a while.