Fig. 3.
Download original image
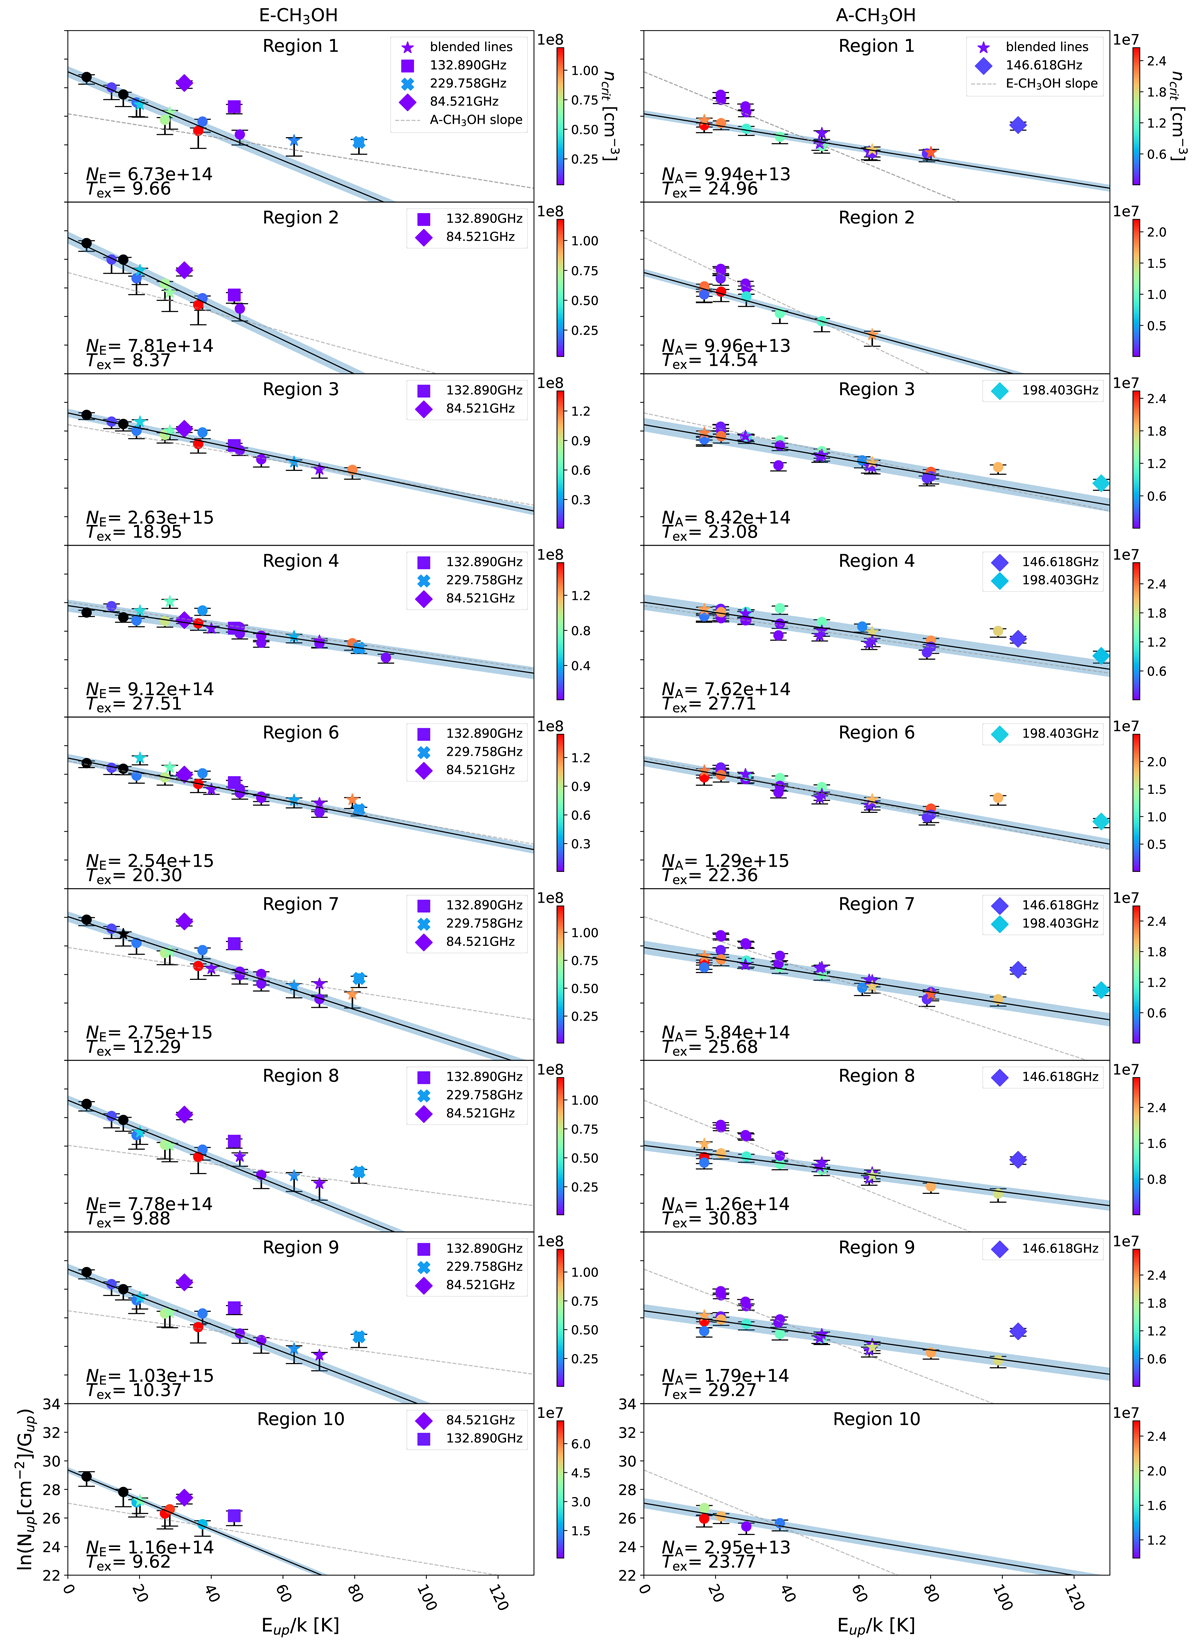
Rotation diagrams based on our selected methanol transitions (Table A.1) and separated by methanol symmetric type (E–CH3OH and A–CH3OH). Straight black lines represent our best fits to the data considering only methanol lines not blended with other methanol lines (see Sect. 4.1) and following LTE conditions. Dotted gray lines are the slopes of the complementary methanol symmetric type in the same region. Maser candidates (see Sect. 4.1) are labeled with symbols. Points are color-coded depending on their critical densities (in units of cm−3), as indicated by the color bar to their right (transitions with unavailable critical densities are in black). In the bottom left corner of each panel, the column density (NE − CH3OH and NA − CH3OH, in cm−2) and the excitation temperature (Tex, in Kelvin) derived from the fit are indicated. Non-blended lines in LTE are marked by circles, while methanol lines blended with other methanol lines (at Eup/k > 150 K) are assigned by stars. Shaded areas represent 1σ uncertainties (see Sect. 4.1).
Current usage metrics show cumulative count of Article Views (full-text article views including HTML views, PDF and ePub downloads, according to the available data) and Abstracts Views on Vision4Press platform.
Data correspond to usage on the plateform after 2015. The current usage metrics is available 48-96 hours after online publication and is updated daily on week days.
Initial download of the metrics may take a while.