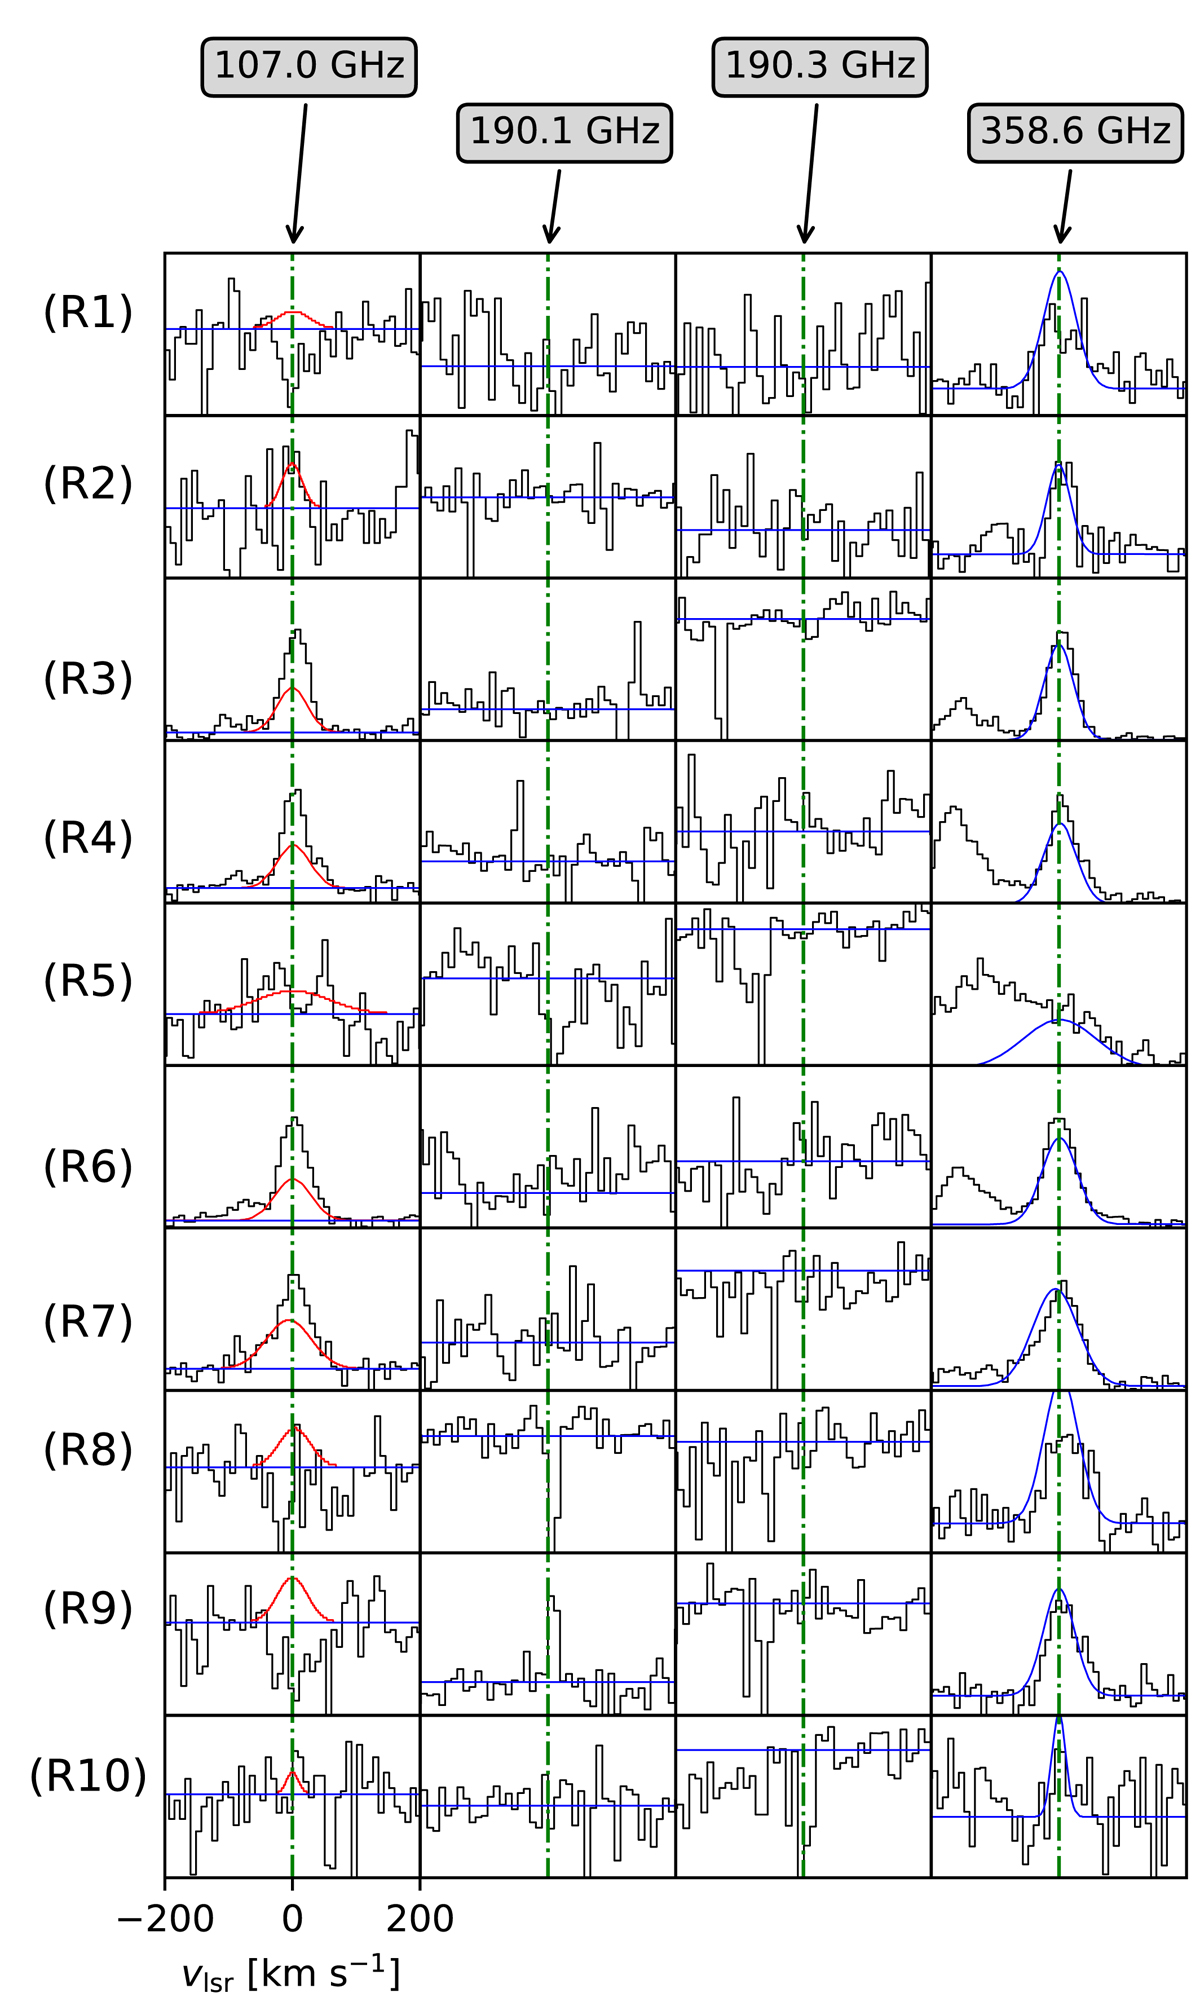
Fig. 2.
Download original image
Methanol lines observed in absorption or self-absorption in one or more of the selected regions (Table 1). Red and blue lines are synthetic spectra for methanol A- and E- type, respectively (see Sect. 4.2). Line frequencies are labeled in the top of the figure, while the velocity range (in km s−1, after applying the radio convention (https://web-archives.iram.fr/IRAMFR/ARN/may95/node4.html) and subtracting the vLSR velocities from Table 1) is indicated in the bottom-left corner. Regions 1–10 are ordered from top to bottom as indicated in the leftmost panel (y-axis: R from “Region” plus the corresponding number). For the location of the regions, see Fig. 1 and Table 1.
Current usage metrics show cumulative count of Article Views (full-text article views including HTML views, PDF and ePub downloads, according to the available data) and Abstracts Views on Vision4Press platform.
Data correspond to usage on the plateform after 2015. The current usage metrics is available 48-96 hours after online publication and is updated daily on week days.
Initial download of the metrics may take a while.