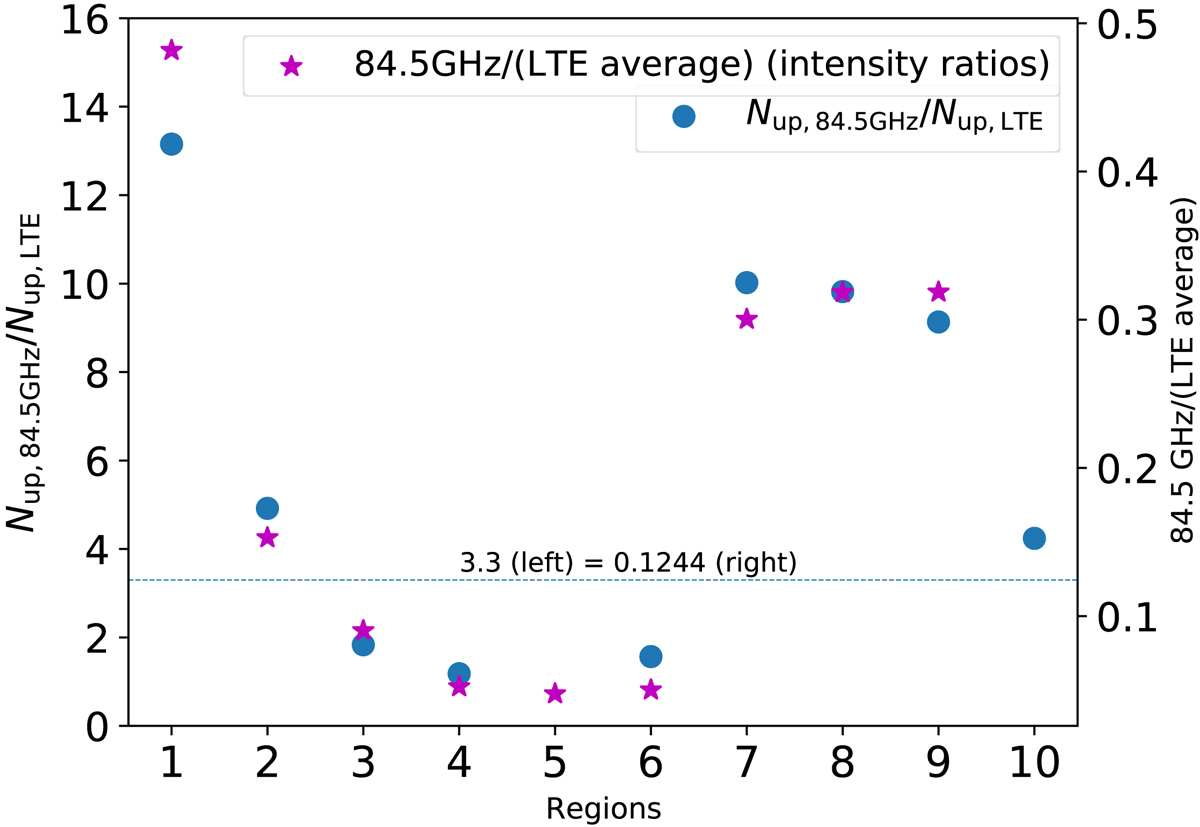
Fig. F.1.
Download original image
Magenta stars are scaled according to the left y-axis, and are equivalent to the magenta stars in the first panel of Fig. 6. Blue dots are scaled with respect to the right y-axis and correspond to integrated intensities of the 5−1→40 − E methanol transition at 84.5 GHz over an LTE approximation (see Sect. 5.2) averaged inside a beam size aperture (1![]() 6 diameter) for each of the studied regions in this work (see Table 3).
6 diameter) for each of the studied regions in this work (see Table 3).
Current usage metrics show cumulative count of Article Views (full-text article views including HTML views, PDF and ePub downloads, according to the available data) and Abstracts Views on Vision4Press platform.
Data correspond to usage on the plateform after 2015. The current usage metrics is available 48-96 hours after online publication and is updated daily on week days.
Initial download of the metrics may take a while.