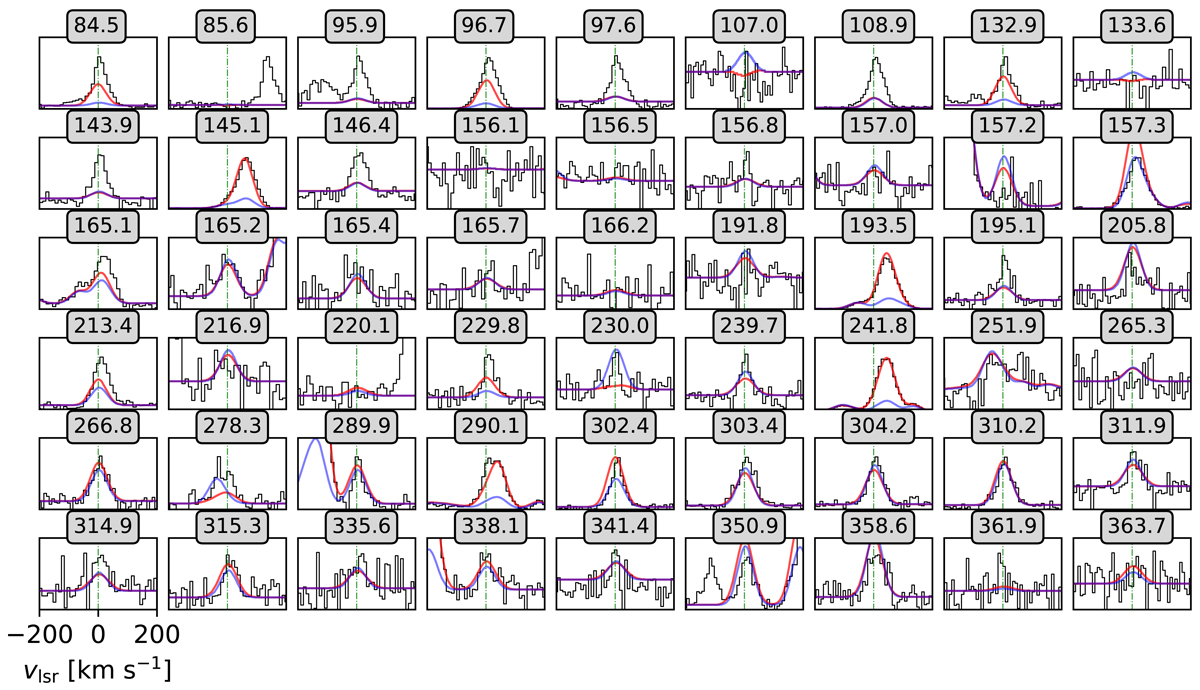
Fig. C.2.
Download original image
Two-component RADEX non-LTE model for region 8 (in red) over-plotted on the rest-frame spectra (in black). The common velocity range is depicted at the bottom left panel and was obtained in the same manner as in Fig. C.1 but this time subtracting a vLSR velocity of 205 km s−1 (see Table 1). Line frequencies are indicated above each panel in GHz and by green dashed lines inside the panels. Previous single-component LTE modeling (see Fig. 7) is shown in blue for comparison.
Current usage metrics show cumulative count of Article Views (full-text article views including HTML views, PDF and ePub downloads, according to the available data) and Abstracts Views on Vision4Press platform.
Data correspond to usage on the plateform after 2015. The current usage metrics is available 48-96 hours after online publication and is updated daily on week days.
Initial download of the metrics may take a while.