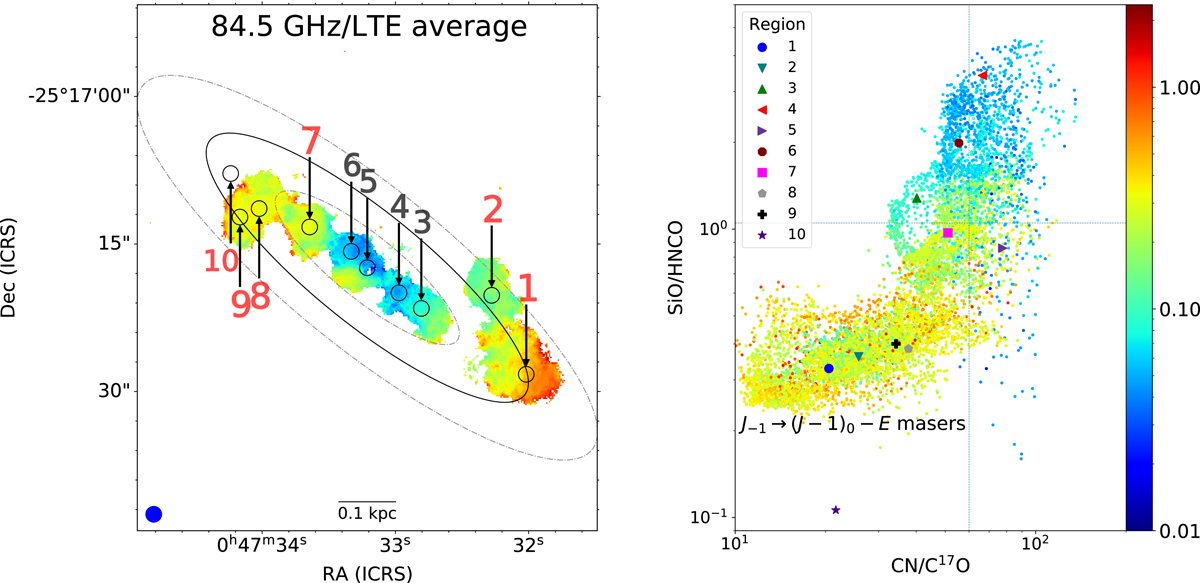
Fig. 13.
Download original image
Left: maser emission distribution per spaxel as observed by dividing integrated intensities of the maser methanol line at 84.5 GHz by the mean intensity value of the surrounding (in terms of Eup/k) methanol lines in LTE at 218.4 and 310.1 GHz (see Sect. 5.2). A 3σ clipping was applied in all the transitions involved to produce the figure. The center and edges of the inner Lindblad resonance from Iodice et al. (2014) are denoted with a black ellipse and dash-dotted gray ellipses, respectively. Regions where we observe methanol maser emission in the J−1 → (J − 1)0 − E line series are labeled in red. Right: same spaxels (with their values as colors) as in the figure to the left, but this time distributed according to their ratios in the SiO/HNCO (y-axis) and CN/C17O line ratio maps in ALMA band 3. A logarithmic stretch has been applied in both panels for an easy visualization. Colors are in common for both panels. Our threshold of 3.3 above the rotation diagram fit given in Fig. 6 (first panel) corresponds to an intensity ratio of > 0.1244 (see Appendix F).
Current usage metrics show cumulative count of Article Views (full-text article views including HTML views, PDF and ePub downloads, according to the available data) and Abstracts Views on Vision4Press platform.
Data correspond to usage on the plateform after 2015. The current usage metrics is available 48-96 hours after online publication and is updated daily on week days.
Initial download of the metrics may take a while.