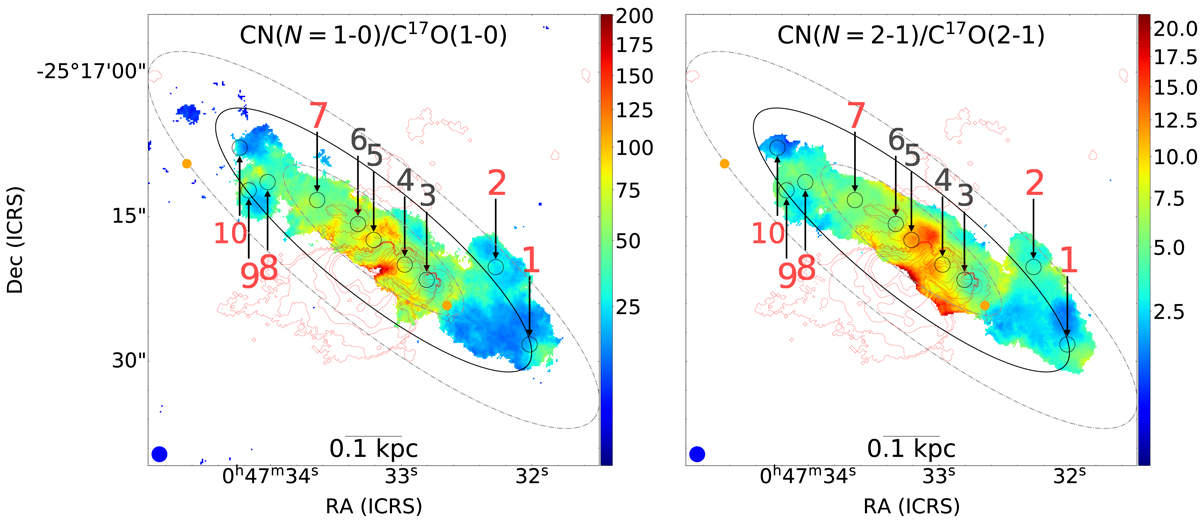
Fig. 12.
Download original image
CN (N = 1 − 0)/C17O (J = 1 − 0) (left) and CN (N = 2 − 1)/C17O (J = 2 − 1) (right) line ratios obtained from ALCHEMI data (Martín et al. 2021), indicating the presence of photodissociation regions. A 3σ clipping was applied. Red contours indicate the Hα emission in logarithmic scale from MUSE archival data (ID:0102.B-0078(A), PI:Laura Zschaechner). Regions where we detect Class I maser emission in the J−1 → (J − 1)0 − E series (see Sect. 4.1.2) are labeled in red and with slightly larger numbers. The center and edges of the inner Lindblad resonance from Iodice et al. (2014) are denoted with a black ellipse and dash-dotted gray ellipses, respectively. Higher ratios indicate a higher photodissociation level. A square root stretch has been applied for an easy visualization.
Current usage metrics show cumulative count of Article Views (full-text article views including HTML views, PDF and ePub downloads, according to the available data) and Abstracts Views on Vision4Press platform.
Data correspond to usage on the plateform after 2015. The current usage metrics is available 48-96 hours after online publication and is updated daily on week days.
Initial download of the metrics may take a while.